HOT TOPICS LIST
- MACD
- Fibonacci
- RSI
- Gann
- ADXR
- Stochastics
- Volume
- Triangles
- Futures
- Cycles
- Volatility
- ZIGZAG
- MESA
- Retracement
- Aroon
INDICATORS LIST
LIST OF TOPICS
PRINT THIS ARTICLE
by Paolo Pezzutti
In the long term, prices are developing a sideways move.
Position: Accumulate
Paolo Pezzutti
Author of the book "Trading the US Markets - A Comprehensive Guide to US Markets for International Traders and Investors" - Harriman House (July 2008)
PRINT THIS ARTICLE
TECHNICAL ANALYSIS
Morgan Stanley Is Testing Resistance Levels
03/27/06 01:16:42 PMby Paolo Pezzutti
In the long term, prices are developing a sideways move.
Position: Accumulate
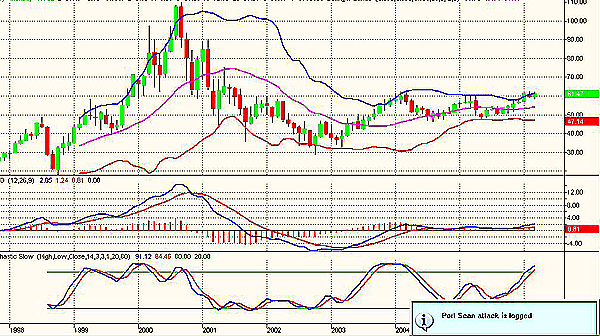
| Morgan Stanley (MS) is testing resistance levels not touched since 2004. In Figure 1, you can see the monthly chart. Note that prices are well below the November 2000 high of $110. In this time frame, prices have partly recovered from losses suffered between 2000 and 2002. Since 2004, prices are moving in a trading range environment oscillating between $50 and $60. The flat Bollinger Bands and the moving average convergence/divergence (MACD) confirm this type of condition for the stock. Prices are tagging the upper band with the stochastic overbought, which means the stock is at a resistance level. It is important to see if a breakout will move prices up to the $70 level. |

|
| FIGURE 1: MORGAN STANLEY, MONTHLY. During the past two years, prices have been moving sideways |
| Graphic provided by: TradeStation. |
| |
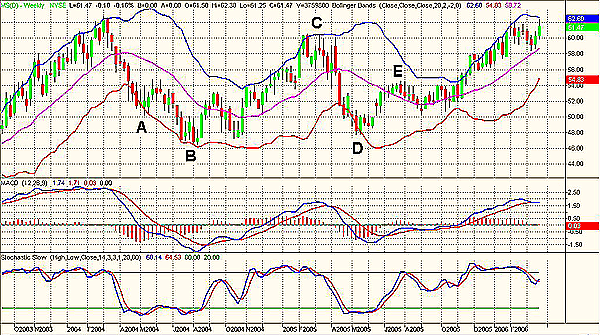
| In Figure 2, I have highlighted the trading range in the weekly time frame started back in 2004. A first leg of correction in the form of an a-b-c developed between March and August 2004. Note that at point A, a first entry point was not signaled correctly by the stochastic. Instead, point B represented an excellent entry opportunity. At point C, prices printed a top only to develop a fast correction until point D, where the oscillator left the oversold area and provided a good entry level. The last up leg moved prices higher quickly to point E. From there, a long congestion phase developed, resulting in an accumulation that moved prices to the present levels. Currently, the stock is testing the previous relative top, but the oscillator has already left the overbought area, indicating that new highs could be printed in coincidence with a negative divergence. The MACD is flat, although the red histogram is displaying a negative divergence. The Bollinger Bands are converging and indicate that a consolidation is ongoing. |

|
| FIGURE 2: MORGAN STANLEY, WEEKLY. Prices are in the upper portion of the trading range. |
| Graphic provided by: TradeStation. |
| |
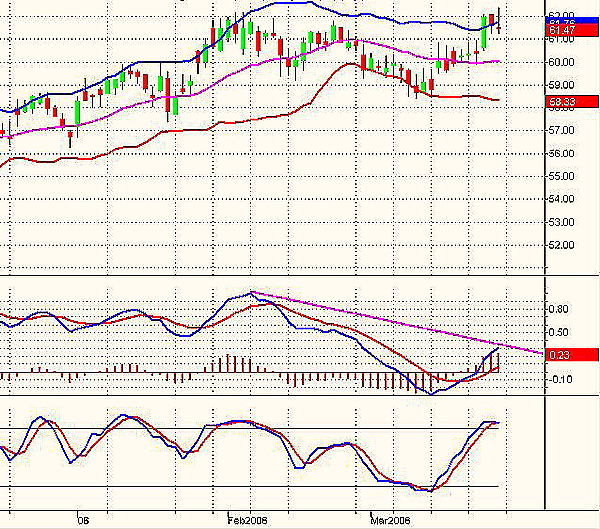
| In Figure 3, you can see the daily chart. In this time frame, the last leg of the uptrend initiated in March has presented low momentum with flat Bollinger Bands. At present, the stochastic is already overbought. Consider also that during the last trading session, after a weak open within the previous day's range, prices managed to print new highs. However, at the end of the session, they went even below the open, indicating that so far, the stock does not have the strength to continue higher. The high of this trading day now represents a significant resistance. There are no elements to believe that an impulse is ongoing. Chances are that prices will consolidate longer before attempting to test and break out from recent highs again. Accumulation during weakness is a possibility. |

|
| FIGURE 3: MORGAN STANLEY, DAILY. The stock is showing weakness in the short term. The high of the last trading session is now a resistance to the continuation of the up move. |
| Graphic provided by: TradeStation. |
| |
Author of the book "Trading the US Markets - A Comprehensive Guide to US Markets for International Traders and Investors" - Harriman House (July 2008)
| Address: | VIA ROBERTO AGO 26 POSTAL CODE 00166 |
| Rome, ITALY | |
| Phone # for sales: | +393357540708 |
| E-mail address: | pezzutti.paolo@tiscali.it |
Click here for more information about our publications!
Comments
Date: 03/28/06Rank: 3Comment:

Request Information From Our Sponsors
- StockCharts.com, Inc.
- Candle Patterns
- Candlestick Charting Explained
- Intermarket Technical Analysis
- John Murphy on Chart Analysis
- John Murphy's Chart Pattern Recognition
- John Murphy's Market Message
- MurphyExplainsMarketAnalysis-Intermarket Analysis
- MurphyExplainsMarketAnalysis-Visual Analysis
- StockCharts.com
- Technical Analysis of the Financial Markets
- The Visual Investor
- VectorVest, Inc.
- Executive Premier Workshop
- One-Day Options Course
- OptionsPro
- Retirement Income Workshop
- Sure-Fire Trading Systems (VectorVest, Inc.)
- Trading as a Business Workshop
- VectorVest 7 EOD
- VectorVest 7 RealTime/IntraDay
- VectorVest AutoTester
- VectorVest Educational Services
- VectorVest OnLine
- VectorVest Options Analyzer
- VectorVest ProGraphics v6.0
- VectorVest ProTrader 7
- VectorVest RealTime Derby Tool
- VectorVest Simulator
- VectorVest Variator
- VectorVest Watchdog
