HOT TOPICS LIST
- MACD
- Fibonacci
- RSI
- Gann
- ADXR
- Stochastics
- Volume
- Triangles
- Futures
- Cycles
- Volatility
- ZIGZAG
- MESA
- Retracement
- Aroon
INDICATORS LIST
LIST OF TOPICS
PRINT THIS ARTICLE
by Gary Grosschadl
Has the 16-year bear trend ended for the Nikkei?
Position: Buy
Gary Grosschadl
Independent Canadian equities trader and technical analyst based in Peterborough
Ontario, Canada.
PRINT THIS ARTICLE
REV HEAD & SHOULDERS
Signs Of A Nikkei Bottom
03/27/06 11:14:20 AMby Gary Grosschadl
Has the 16-year bear trend ended for the Nikkei?
Position: Buy
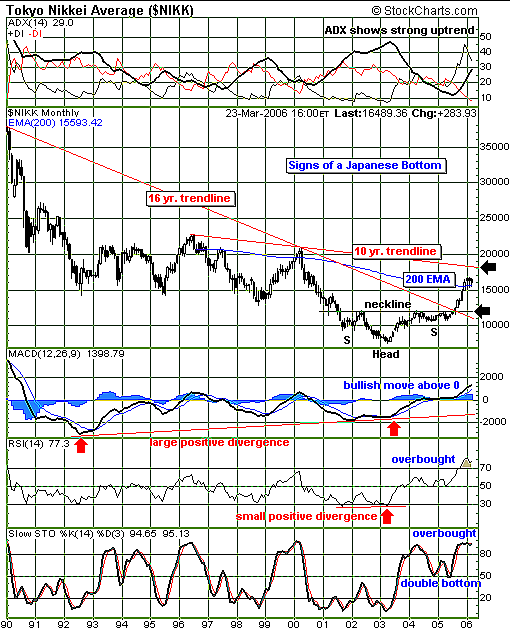
| It's been a long bear trend for the Japanese markets. This long-term monthly chart (Figure 1) shows evidence of an important turnaround, which may be the start of a substantial economic recovery for this Asian powerhouse. |
| A small reverse head & shoulders pattern can be seen at the bottom of Figure 1. A reverse head & shoulders is simply a mirror image of the classic topping pattern. The left shoulder and head is very clear, as is the neckline. The right shoulder is not striking, but it's there, nevertheless. The upside target for such a pattern has already been realized. The distance from the head to the neckline (~4000 points) as applied to a move above the neckline is roughly 16,000. Traders who spotted this pattern early on would already have profited. |

|
| FIGURE 1: NIKKEI, MONTHLY. This chart suggests an important reversal in the Japanese market. |
| Graphic provided by: StockCharts.com. |
| |
| What is more significant on this chart is that a 16-year trendline has been broken to the upside. Ironically, this occurred at the same time the head & shoulders neckline was broken, giving more significance to the move. Now that two possible trading targets have been reached, the pattern fulfillment target and the overhead 200-period moving average, a pause here would be no surprise. Once this gain is consolidated, the next upside target is indicated at the 10-year trendline at 18,000. Continuing strength above the 200-day exponential moving average (EMA) could lead to large future gains as other traders decide a true turnaround is in the making. |
| Several indicators are worth taking into consideration. At the top of the chart, the average directional movement index (ADX) could not be more positive. It is enjoying a strong upslope coming off a bottom, and it is above the 20-25 threshold at a current 29. Below the chart, the moving average convergence/divergence (MACD) shows a strong move above the zero line and also reveals a large positive divergence to price action. The relative strength index (RSI) shows a small, more recent positive divergence (also seen with the MACD) between the left shoulder and the head of the formation. A cautionary note with the overbought parameters on the RSI and stochastics oscillator: this points to a possibility of a downturn, but until the stochastics dips below 80, this stay can be extended. |
| When a daily chart suggests a reversal, it is a good sign, but when a weekly chart suggests a reversal, it is more promising. When a monthly chart points toward a reversal, a much bigger move may be in the making. This would be a welcome turn of events for the Japanese marketplace. What goes down must eventually go back up. Lately in North America, the reverse case has been bandied about. That makes me wonder if "big money" will bank North American profits and take part in this potential Asian turnaround. |
Independent Canadian equities trader and technical analyst based in Peterborough
Ontario, Canada.
| Website: | www.whatsonsale.ca/financial.html |
| E-mail address: | gwg7@sympatico.ca |
Click here for more information about our publications!
Comments
Date: 03/27/06Rank: 5Comment:
Date: 03/27/06Rank: 5Comment: Please can we have more technical analysis (long and short term) of major markets and ETfs. This article on the Nikkei is invaluable. I fo not understand how Traders chooses which individual stocks to analyse--it seems arbitrary at best--but for many of us who are traders but not daytraders the ETFs (and there are many more now to choose from) are what we use to trade. Please--more indexes and ETF analysis, less individual stock analysis! Thanks.
Date: 03/28/06Rank: 5Comment:

Request Information From Our Sponsors
- StockCharts.com, Inc.
- Candle Patterns
- Candlestick Charting Explained
- Intermarket Technical Analysis
- John Murphy on Chart Analysis
- John Murphy's Chart Pattern Recognition
- John Murphy's Market Message
- MurphyExplainsMarketAnalysis-Intermarket Analysis
- MurphyExplainsMarketAnalysis-Visual Analysis
- StockCharts.com
- Technical Analysis of the Financial Markets
- The Visual Investor
- VectorVest, Inc.
- Executive Premier Workshop
- One-Day Options Course
- OptionsPro
- Retirement Income Workshop
- Sure-Fire Trading Systems (VectorVest, Inc.)
- Trading as a Business Workshop
- VectorVest 7 EOD
- VectorVest 7 RealTime/IntraDay
- VectorVest AutoTester
- VectorVest Educational Services
- VectorVest OnLine
- VectorVest Options Analyzer
- VectorVest ProGraphics v6.0
- VectorVest ProTrader 7
- VectorVest RealTime Derby Tool
- VectorVest Simulator
- VectorVest Variator
- VectorVest Watchdog
