HOT TOPICS LIST
- MACD
- Fibonacci
- RSI
- Gann
- ADXR
- Stochastics
- Volume
- Triangles
- Futures
- Cycles
- Volatility
- ZIGZAG
- MESA
- Retracement
- Aroon
INDICATORS LIST
LIST OF TOPICS
PRINT THIS ARTICLE
by David Penn
The minimum price objective reached, the breakout from a symmetrical triangle in the Dow Jones Industrial Average meets resistance.
Position: N/A
David Penn
Technical Writer for Technical Analysis of STOCKS & COMMODITIES magazine, Working-Money.com, and Traders.com Advantage.
PRINT THIS ARTICLE
TRIANGLES
Triangle Target
03/27/06 08:20:59 AMby David Penn
The minimum price objective reached, the breakout from a symmetrical triangle in the Dow Jones Industrial Average meets resistance.
Position: N/A
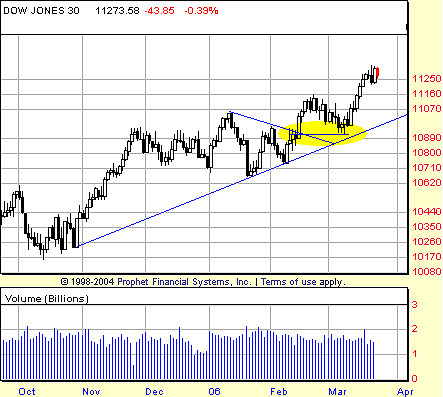
| I've been hinting at the bullish prospects for the Dow Jones Industrial Average (DJIA) for the past month and a half ("The Dow's Tempting Triangle," February 14, 2006; "Confirming Industrials," February 17, 2006). With the recent close in the DJIA of 11317 on March 22 (and an intraday high of over the 11334 level the previous day), it is clear that the promise of those prospects has arrived. |

|
| FIGURE 1: DOW JONES INDUSTRIAL AVERAGE, DAILY. The breakout from the January/February symmetrical triangle reached its minimum price objective on an intraday basis on March 21. Note how prices pulled back in early March after the mid-February breakout, finding support at the precise level of the initial breakout. |
| Graphic provided by: Prophet Financial, Inc. |
| |
| The breakout from the symmetrical triangle has been an interesting ride. The initial breakout came in mid-February, but by the end of the month it appeared as if the rally was losing steam. As Figure 1 shows, the breakout was really just the continuation of the advance from the mid- to late January bottom (created by the big volume down day on January 20). The correction in the first half of February did not create a new low (that is, did not take out the mid-January low), which was the first indication that the market might have put in a significant low back in January. |
| Also interesting in Figure 1 is the way that the pullback after the initial breakout found support at precisely the same level as the breakout. There were at least three different attempts by the bears to push the DJIA below that breakout level in early March, and the bulls repelled all efforts. In the context of an uptrend (that is, higher highs and higher lows since mid-January), that was enough to get enough bears to abandon the fight, allowing the market to move higher in March. |

|
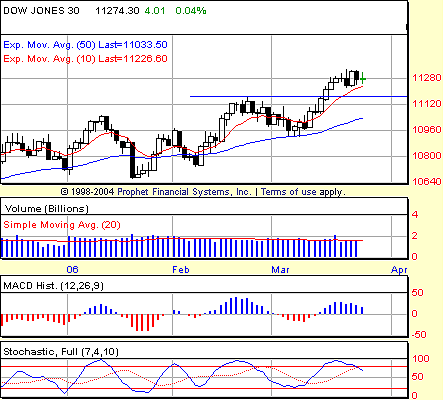
| FIGURE 2: DOW JONES INDUSTRIAL AVERAGE, DAILY. Finding support in early March on the 50-day exponential moving average, the Dow 30 rallied strongly in the middle of the month and broke out above the February highs. The February highs now represent a measure of support and a test of the rally's strength, should the DJIA pull back and/or consolidate, post-breakout. |
| Graphic provided by: Prophet Financial, Inc. |
| |
| There's something else about the March rally that is worth noting (Figure 2). So far, the DJIA has managed to hold its breakout. By that, I'm referring to the DLB ("Don't Look Back") breakouts about which I've written for Working-Money.com. While it remains possible for the DJIA to reverse and close below the level of the February highs, the longer it takes for such an event to happen, the stronger the case that the breakout and rally will lead to still higher prices. (See my article "Building A Better Breakout," Working-Money.com, July 1, 2003.) |
| How much upside remains? Because the DJIA has reached the minimum upside projection from the symmetrical triangle breakout, it is probably a good time to begin thinking about taking profits. If in fact this is a "minimum" upside projection, then rather than trying to squeeze every last drop of profit from the move, it may be more prudent for speculators to watch for the next big rally day and to use that strength — again, from a trading perspective — to sell. |
Technical Writer for Technical Analysis of STOCKS & COMMODITIES magazine, Working-Money.com, and Traders.com Advantage.
| Title: | Technical Writer |
| Company: | Technical Analysis, Inc. |
| Address: | 4757 California Avenue SW |
| Seattle, WA 98116 | |
| Phone # for sales: | 206 938 0570 |
| Fax: | 206 938 1307 |
| Website: | www.Traders.com |
| E-mail address: | DPenn@traders.com |
Traders' Resource Links | |
| Charting the Stock Market: The Wyckoff Method -- Books | |
| Working-Money.com -- Online Trading Services | |
| Traders.com Advantage -- Online Trading Services | |
| Technical Analysis of Stocks & Commodities -- Publications and Newsletters | |
| Working Money, at Working-Money.com -- Publications and Newsletters | |
| Traders.com Advantage -- Publications and Newsletters | |
| Professional Traders Starter Kit -- Software | |
Click here for more information about our publications!
Comments
Date: 03/27/06Rank: 3Comment:
Date: 03/28/06Rank: 5Comment:

Request Information From Our Sponsors
- StockCharts.com, Inc.
- Candle Patterns
- Candlestick Charting Explained
- Intermarket Technical Analysis
- John Murphy on Chart Analysis
- John Murphy's Chart Pattern Recognition
- John Murphy's Market Message
- MurphyExplainsMarketAnalysis-Intermarket Analysis
- MurphyExplainsMarketAnalysis-Visual Analysis
- StockCharts.com
- Technical Analysis of the Financial Markets
- The Visual Investor
- VectorVest, Inc.
- Executive Premier Workshop
- One-Day Options Course
- OptionsPro
- Retirement Income Workshop
- Sure-Fire Trading Systems (VectorVest, Inc.)
- Trading as a Business Workshop
- VectorVest 7 EOD
- VectorVest 7 RealTime/IntraDay
- VectorVest AutoTester
- VectorVest Educational Services
- VectorVest OnLine
- VectorVest Options Analyzer
- VectorVest ProGraphics v6.0
- VectorVest ProTrader 7
- VectorVest RealTime Derby Tool
- VectorVest Simulator
- VectorVest Variator
- VectorVest Watchdog
