HOT TOPICS LIST
- MACD
- Fibonacci
- RSI
- Gann
- ADXR
- Stochastics
- Volume
- Triangles
- Futures
- Cycles
- Volatility
- ZIGZAG
- MESA
- Retracement
- Aroon
INDICATORS LIST
LIST OF TOPICS
PRINT THIS ARTICLE
by Gary Grosschadl
What was the reason for the breakout?
Position: Buy
Gary Grosschadl
Independent Canadian equities trader and technical analyst based in Peterborough
Ontario, Canada.
PRINT THIS ARTICLE
ASCENDING TRIANGLES
Breakout For Suntrust
03/21/06 10:10:36 AMby Gary Grosschadl
What was the reason for the breakout?
Position: Buy
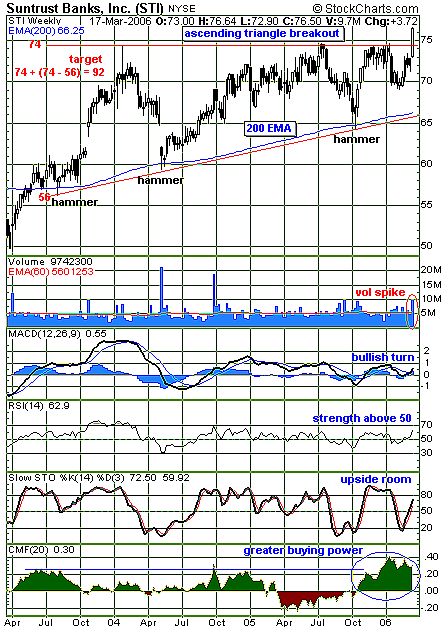
| SunTrust Investment Services has been named the "Best Large Institution Program of the Year" for 2005 by the Bank Insurance & Securities Association. Figure 1, a weekly chart, shows a breakout occurring. Did the award fuel the rise? Typical of this bullish pattern of an ascending triangle, the pattern tightens until a break occurs. With good news or perception of good value, the pattern's bullish bias comes to fruition. |
| Volume provides important clues for most breakouts. Abnormal volume or at least a higher spike adds conviction to the move. Ideally, higher than normal volume continues to drive the rise, or there is danger of a false breakout. After the initial excitement is over, there can be a retest of the breakout point. This can be more telling and offers a chance at better prices for new buyers coming in as opposed to chasing the initial surge higher. |

|
| FIGURE 1: SUNTRUST, WEEKLY. This chart of STI shows a breakout for this financial services company. |
| Graphic provided by: StockCharts.com. |
| |
| The indicators below Figure 1 confirm this bullish thrust. The moving average convergence/divergence (MACD) shows a bullish turn above its zero line, while the relative strength index (RSI) shows a bullish rise past its key 50 level. The stochastics oscillator shows an upleg occurring with upside room. The Chaikin money flow indicator shows a healthy growth in buying power. |
| The target for a triangle breakout is a move above the top trendline equal to the widest part of the formation. Ideally, this is $92 (see Figure 1) and may take some time to be realized. If this breakout fails and returns back inside the triangle, all bullish bets are off. |
Independent Canadian equities trader and technical analyst based in Peterborough
Ontario, Canada.
| Website: | www.whatsonsale.ca/financial.html |
| E-mail address: | gwg7@sympatico.ca |
Click here for more information about our publications!
Comments
Date: 03/21/06Rank: 5Comment:

Request Information From Our Sponsors
- StockCharts.com, Inc.
- Candle Patterns
- Candlestick Charting Explained
- Intermarket Technical Analysis
- John Murphy on Chart Analysis
- John Murphy's Chart Pattern Recognition
- John Murphy's Market Message
- MurphyExplainsMarketAnalysis-Intermarket Analysis
- MurphyExplainsMarketAnalysis-Visual Analysis
- StockCharts.com
- Technical Analysis of the Financial Markets
- The Visual Investor
- VectorVest, Inc.
- Executive Premier Workshop
- One-Day Options Course
- OptionsPro
- Retirement Income Workshop
- Sure-Fire Trading Systems (VectorVest, Inc.)
- Trading as a Business Workshop
- VectorVest 7 EOD
- VectorVest 7 RealTime/IntraDay
- VectorVest AutoTester
- VectorVest Educational Services
- VectorVest OnLine
- VectorVest Options Analyzer
- VectorVest ProGraphics v6.0
- VectorVest ProTrader 7
- VectorVest RealTime Derby Tool
- VectorVest Simulator
- VectorVest Variator
- VectorVest Watchdog
