HOT TOPICS LIST
- MACD
- Fibonacci
- RSI
- Gann
- ADXR
- Stochastics
- Volume
- Triangles
- Futures
- Cycles
- Volatility
- ZIGZAG
- MESA
- Retracement
- Aroon
INDICATORS LIST
LIST OF TOPICS
PRINT THIS ARTICLE
by Gary Grosschadl
After a great run from $26 to $40, Adobe has reversed course.
Position: Sell
Gary Grosschadl
Independent Canadian equities trader and technical analyst based in Peterborough
Ontario, Canada.
PRINT THIS ARTICLE
DESCENDING TRIANGLES
Adobe Systems' Triangle Top
03/20/06 10:04:43 AMby Gary Grosschadl
After a great run from $26 to $40, Adobe has reversed course.
Position: Sell
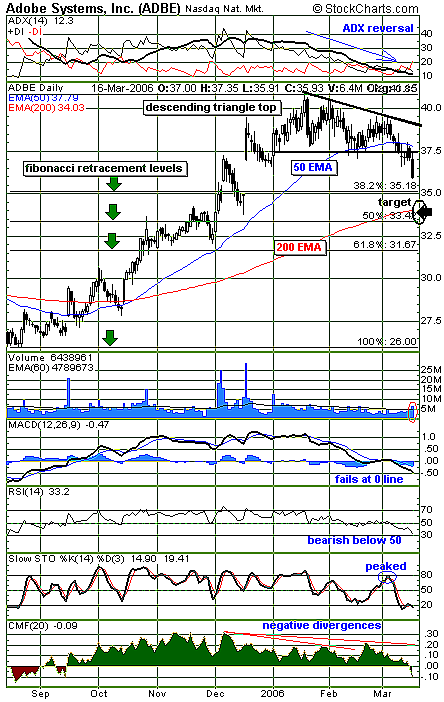
| This daily chart (Figure 1) shows a topping formation via a descending triangle breakdown. The descending triangle has a bearish bias, especially after a long run. Note how the 50-day exponential moving average (EMA) foretold the coming breakdown as it was broken several days previously. |
| To determine a plausible trading target, several tools are used to determine a confluence of support. Using the pattern fulfillment target, moving average support, and a common Fibonacci retracement level, the target zone becomes 33.42 to 34. The pattern target equals the maximum height of the triangle, applied to the downside break, or 37.50 - 3.50 = 34. The current 200-day EMA is 34.03, so this apparent agreement will not go unnoticed by technical traders. Fibonacci retracement levels must also be considered. The 50% target is at 33.42. Should this level not meet support, then the other Fibonacci targets may come into play — either early support off 35.18 (38.2% retracement) or additional downside at 31.67 (61.8%). Under super-bear conditions, the ultimate downside support target would be 100% retracement to previous lows of $26. |

|
| FIGURE 1: ADOBE SYSTEMS, DAILY. Topping formation is clear on this daily chart of ADBE. |
| Graphic provided by: StockCharts.com. |
| |
| Several indicators must also be considered. At the top of the chart, the average directional movement index (ADX) line peaked early in the triangle formation. The subsequent decline hinted at the bull trend weakening to the point of reversal. Below the chart, the MACD shows a bear trend as the zero line failed to inspire a bounce. The relative strength index (RSI) also tipped a bearish hand with weakness at its often-key 50 area. Meanwhile, the stochastic oscillator clearly showed a downleg as the stock bounced off the top trendline. |
| Whether the target zone holds support or merely causes a pause in this downleg remains to be seen. Looking ahead, a retest of the breakdown point of 37.50 or the 50-day EMA should be a future consideration. Failure there could cause a round of short-selling and another move south for the stock price. |
Independent Canadian equities trader and technical analyst based in Peterborough
Ontario, Canada.
| Website: | www.whatsonsale.ca/financial.html |
| E-mail address: | gwg7@sympatico.ca |
Click here for more information about our publications!
Comments
Date: 03/20/06Rank: 5Comment:
Date: 03/28/06Rank: 3Comment:

Request Information From Our Sponsors
- StockCharts.com, Inc.
- Candle Patterns
- Candlestick Charting Explained
- Intermarket Technical Analysis
- John Murphy on Chart Analysis
- John Murphy's Chart Pattern Recognition
- John Murphy's Market Message
- MurphyExplainsMarketAnalysis-Intermarket Analysis
- MurphyExplainsMarketAnalysis-Visual Analysis
- StockCharts.com
- Technical Analysis of the Financial Markets
- The Visual Investor
- VectorVest, Inc.
- Executive Premier Workshop
- One-Day Options Course
- OptionsPro
- Retirement Income Workshop
- Sure-Fire Trading Systems (VectorVest, Inc.)
- Trading as a Business Workshop
- VectorVest 7 EOD
- VectorVest 7 RealTime/IntraDay
- VectorVest AutoTester
- VectorVest Educational Services
- VectorVest OnLine
- VectorVest Options Analyzer
- VectorVest ProGraphics v6.0
- VectorVest ProTrader 7
- VectorVest RealTime Derby Tool
- VectorVest Simulator
- VectorVest Variator
- VectorVest Watchdog
