HOT TOPICS LIST
- MACD
- Fibonacci
- RSI
- Gann
- ADXR
- Stochastics
- Volume
- Triangles
- Futures
- Cycles
- Volatility
- ZIGZAG
- MESA
- Retracement
- Aroon
INDICATORS LIST
LIST OF TOPICS
PRINT THIS ARTICLE
by Paolo Pezzutti
The stock reacted well after the negative earnings report -- too well.
Position: Hold
Paolo Pezzutti
Author of the book "Trading the US Markets - A Comprehensive Guide to US Markets for International Traders and Investors" - Harriman House (July 2008)
PRINT THIS ARTICLE
American International Group Tests Trading Range Resistance
03/20/06 11:42:37 AMby Paolo Pezzutti
The stock reacted well after the negative earnings report -- too well.
Position: Hold
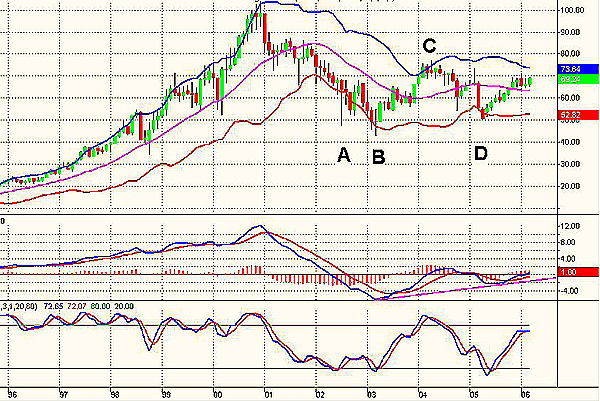
| American International Group (AIG) provides general and life insurance operations, financial services, retirement savings, and asset management. Since 2003, shares have been moving sideways in a trading range between $50 and $70-75. In Figure 1, you can see the monthly chart that displays how prices are still well below the 2000 top at about $103. The flat Bollinger Bands confirm the present trading environment. During these phases it is clear that oscillators work well. Note how the slow stochastic indicated entry and exit points during the past years. At point A, the entry point was too early. A lower low printed a few months later associated with the oversold indicator allowed a better entry level (point B). The following indications at points C and D were also fine. At the moment, the stochastic is still not oversold with prices that have not yet tagged the upper Bollinger Band. The moving average convergence/divergence (MACD) reports that prices do not have momentum in this phase. The relative low at point D was printed with the indicator displaying a positive divergence. In the medium term, prices could continue upward and test the resistance levels. |

|
| FIGURE 1: AIG, MONTHLY. The stock has been moving sideways during the past years, well below the 2000 top. |
| Graphic provided by: TradeStation. |
| |
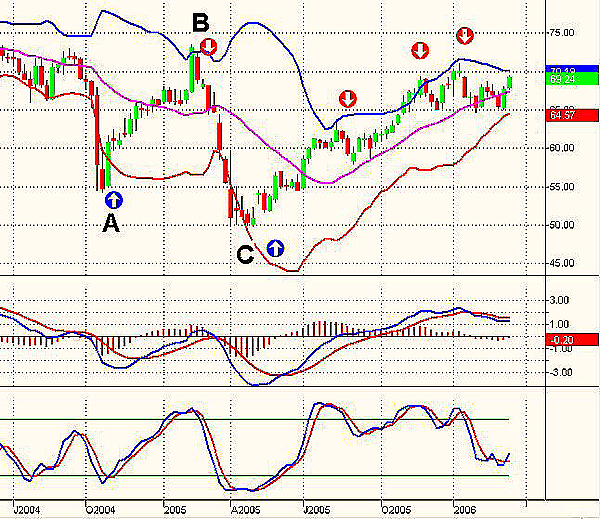
| In the weekly time frame (Figure 2), AIG presented a difficult trading environment. At point A, you can see the fast selloff on the week of October 15. Prices printed a wide-ranging bar providing indications of lower prices ahead. But this was not the case, and the stock managed to move up again to test the resistance level in the $73 area (point B). The move required many trading sessions and had an acceleration at the end, only to trap long hands. The reversal has been fast and in only seven sessions brought the stock to new lows at point C. That was a bear trap, and prices slowly but constantly regained the $70 level. This situation of low volatility is confirmed by the Bollinger Bands, which are still closing, and by the MACD, which shows the lack of momentum in this phase. This condition could last for a long time, but eventually, an increase in volatility has to be expected in either direction. Indications provided by the stochastic have been correct at points A, B, and C; later during the past year, however, they did not bring substantial profits. |

|
| FIGURE 2: AIG, WEEKLY. The difficult trading environment is characterized by a decrease in volatility during the past months. |
| Graphic provided by: TradeStation. |
| |
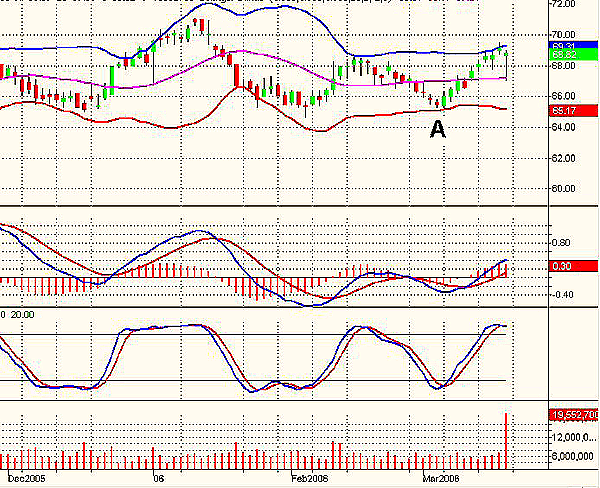
| At the daily level in Figure 3, news about AIG's earnings had a negative impact at the session's prices last Friday, March 17. The Insurance giant reported that its fourth-quarter profit fell 72% after booking more than $2 billion of charges for regulatory settlements and increased reserves. AIG earned $444 million, or 17 cents a share for the quarter compared to $1.61 billion, compared with 62 cents a share a year ago. At the technical level, prices have tagged the Bollinger Bands, which are perfectly flat. The stochastic overbought indicates that the stock could have printed a relative top. After printing a positive divergence at point A, the MACD moved up following the move. However, the momentum of the upleg has been low. Prices in the short term should consolidate. However, the hammer printed on Friday is quite important because after the negative open influenced by the news about earnings, by the end of the session the stock managed to recover the initial loss almost completely. The session has been volatile and the hammer's low is now a significant support in case you intend to open a long position to anticipate the resistance breakout, as it has been printed with volume more than three times the average. |

|
| FIGURE 3: AIG, DAILY. The stock is in the upper part of a trading range and it is testing the resistance level. The hammer printed during the last trading session is now an important support should prices consolidate. |
| Graphic provided by: TradeStation. |
| |
Author of the book "Trading the US Markets - A Comprehensive Guide to US Markets for International Traders and Investors" - Harriman House (July 2008)
| Address: | VIA ROBERTO AGO 26 POSTAL CODE 00166 |
| Rome, ITALY | |
| Phone # for sales: | +393357540708 |
| E-mail address: | pezzutti.paolo@tiscali.it |
Click here for more information about our publications!
Comments
Date: 03/20/06Rank: 3Comment:

Request Information From Our Sponsors
- StockCharts.com, Inc.
- Candle Patterns
- Candlestick Charting Explained
- Intermarket Technical Analysis
- John Murphy on Chart Analysis
- John Murphy's Chart Pattern Recognition
- John Murphy's Market Message
- MurphyExplainsMarketAnalysis-Intermarket Analysis
- MurphyExplainsMarketAnalysis-Visual Analysis
- StockCharts.com
- Technical Analysis of the Financial Markets
- The Visual Investor
- VectorVest, Inc.
- Executive Premier Workshop
- One-Day Options Course
- OptionsPro
- Retirement Income Workshop
- Sure-Fire Trading Systems (VectorVest, Inc.)
- Trading as a Business Workshop
- VectorVest 7 EOD
- VectorVest 7 RealTime/IntraDay
- VectorVest AutoTester
- VectorVest Educational Services
- VectorVest OnLine
- VectorVest Options Analyzer
- VectorVest ProGraphics v6.0
- VectorVest ProTrader 7
- VectorVest RealTime Derby Tool
- VectorVest Simulator
- VectorVest Variator
- VectorVest Watchdog
