

HOT TOPICS LIST
- MACD
- Fibonacci
- RSI
- Gann
- ADXR
- Stochastics
- Volume
- Triangles
- Futures
- Cycles
- Volatility
- ZIGZAG
- MESA
- Retracement
- Aroon
INDICATORS LIST
LIST OF TOPICS
PRINT THIS ARTICLE
by Dennis D. Peterson
Where is the Nasdaq headed? A look at several indicators may give us a prediction.
Position: N/A
Dennis D. Peterson
Market index trading on a daily basis.
PRINT THIS ARTICLE
BULL/BEAR MARKET
Nasdaq
09/05/00 02:46:41 PMby Dennis D. Peterson
Where is the Nasdaq headed? A look at several indicators may give us a prediction.
Position: N/A
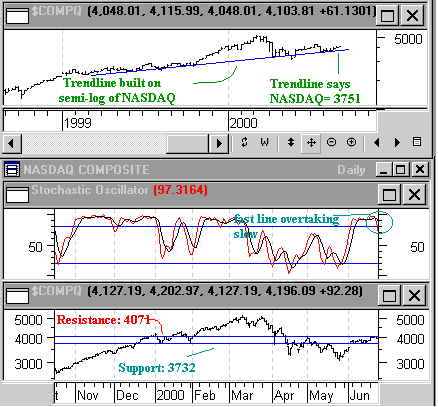
| Several indicators point to the Nasdaq being oversold. As of August 31, 2000, when this article was written, the Nasdaq had been seeing a nice gain. This was also a day for dressing up portfolios, being the last day of the month. The bullishness of the Nasdaq may keep it oversold, but it has also had problems with exceeding some trends and indicators. The semi-log chart of the Nasdaq shows that prices exceed the trendline. Additionally, the stochastic indicates it is in overbought territory. |
| While I use several indicators each day to look at the Nasdaq, this is a representative subset. From an overall standpoint I look first at a version the McClellan oscillator to get a sense of whether the Nasdaq is overbought or oversold. The version I use is a five-day moving average of the advancing minus declining stocks, and it says that the Nasdaq is approaching an overbought threshold. Today's action may push it over. I also watch where the Nasdaq's current value is relative to a trendline I made on a semi-log scale (Figure 1 - upper chart) over the last few months using Nasdaq weekly data. That trendline pegs the Nasdaq at about 3751. Prices are above this level and since investor tolerance for a gain in the rate of price change in the Nasdaq is low, a substantial rise above the trendline is reason to be cautious. |
|
| Figure 1: Nasdaq weekly on a semi-log plot (upper chart), stochastic (middle chart), and Nasdaq daily (lower chart). |
| Graphic provided by: MetaStock. |
| |
| The next thing I look at is whether the Nasdaq is trending or not. If it isn't trending I can use an oscillator like stochastic (Figure 1 - middle chart). The fast line is overtaking the slow line above the threshold, another indication the Nasdaq may be overbought. Using the vertical horizontal filter (VHF), I get a reading around 0.35 as compared to 0.75 when the Nasdaq was in a strong uptrend in November and December of 1999. Recently VHF has been in an uptrend itself. Not surprising, since high, short-term interest rates favor tech stocks. |
| Not actually the last, but always on my screen, are resistance and support lines (Figure 1 - bottom chart). The support line uses the gap up in June as starting point and then goes back to January and February of 2000 where there were two more retests. Support sits at 3732 (comfortably close to the 3751 derived from the semi-log trendline). The resistance line is at 4071 and uses a May 2000 peak and a peak at January 2000. Talk on the net says the Nasdaq has formed a large triangle, but failed to break out early enough to establish a trend. Some are seeing a rising wedge, which is bearish. Decreasing volume is the best assurance that the rising wedge will have a downside breakout. I look to the Nasdaq-100 Trust (QQQ) for this and see a decreasing volume, except for today's volume pop. |
| Odds favor a Nasdaq retracement, but the bullishness of tech is definitely trying to assert itself. A history of price that would fit a pattern a bit stronger would be helpful. Isn't this fun? My position was in today and I am out for tomorrow. |
Market index trading on a daily basis.
| Title: | Staff Writer |
| Company: | Technical Analysis, Inc. |
| Address: | 4757 California Ave SW |
| Seattle, WA 98116-4499 | |
| Phone # for sales: | 206 938 0570 |
| Fax: | 206 938 1307 |
| Website: | www.traders.com |
| E-mail address: | dpeterson@traders.com |
Traders' Resource Links | |
| Charting the Stock Market: The Wyckoff Method -- Books | |
| Working-Money.com -- Online Trading Services | |
| Traders.com Advantage -- Online Trading Services | |
| Technical Analysis of Stocks & Commodities -- Publications and Newsletters | |
| Working Money, at Working-Money.com -- Publications and Newsletters | |
| Traders.com Advantage -- Publications and Newsletters | |
| Professional Traders Starter Kit -- Software | |
Click here for more information about our publications!
Comments

Request Information From Our Sponsors
- StockCharts.com, Inc.
- Candle Patterns
- Candlestick Charting Explained
- Intermarket Technical Analysis
- John Murphy on Chart Analysis
- John Murphy's Chart Pattern Recognition
- John Murphy's Market Message
- MurphyExplainsMarketAnalysis-Intermarket Analysis
- MurphyExplainsMarketAnalysis-Visual Analysis
- StockCharts.com
- Technical Analysis of the Financial Markets
- The Visual Investor
- VectorVest, Inc.
- Executive Premier Workshop
- One-Day Options Course
- OptionsPro
- Retirement Income Workshop
- Sure-Fire Trading Systems (VectorVest, Inc.)
- Trading as a Business Workshop
- VectorVest 7 EOD
- VectorVest 7 RealTime/IntraDay
- VectorVest AutoTester
- VectorVest Educational Services
- VectorVest OnLine
- VectorVest Options Analyzer
- VectorVest ProGraphics v6.0
- VectorVest ProTrader 7
- VectorVest RealTime Derby Tool
- VectorVest Simulator
- VectorVest Variator
- VectorVest Watchdog