HOT TOPICS LIST
- MACD
- Fibonacci
- RSI
- Gann
- ADXR
- Stochastics
- Volume
- Triangles
- Futures
- Cycles
- Volatility
- ZIGZAG
- MESA
- Retracement
- Aroon
INDICATORS LIST
LIST OF TOPICS
PRINT THIS ARTICLE
by Paolo Pezzutti
After a long rally, prices consolidate in the daily time frame for Lehman Brothers.
Position: Accumulate
Paolo Pezzutti
Author of the book "Trading the US Markets - A Comprehensive Guide to US Markets for International Traders and Investors" - Harriman House (July 2008)
PRINT THIS ARTICLE
TECHNICAL ANALYSIS
Lehman Brothers: A Pause In The Long-Term Trend
03/17/06 11:22:16 AMby Paolo Pezzutti
After a long rally, prices consolidate in the daily time frame for Lehman Brothers.
Position: Accumulate
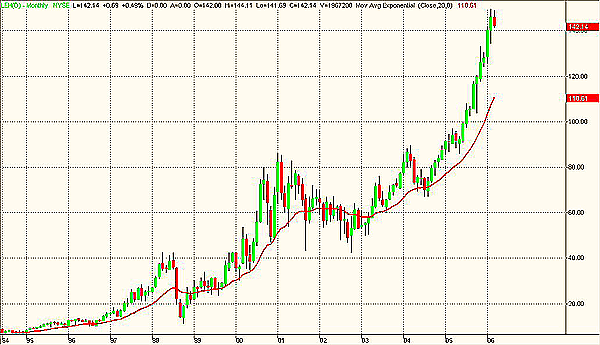
| Lehman Brothers (LEH) provides investment banking services to institutional, corporate, government, and high net worth individuals and customers. The stock trend over the years has been impressive, with prices well above the 2001 high, as can be seen in Figure 1. In 10 years, the stock's value has moved up from $10 to the current $140. Since the beginning of 2005, in fact, the price has started a parabolic rally and now it is very far from its moving average. |

|
| FIGURE 1: LEH, MONTHLY. The stock is printing a parabolic rally. During the past 10 years, prices moved from $10 to $140. |
| Graphic provided by: TradeStation. |
| |
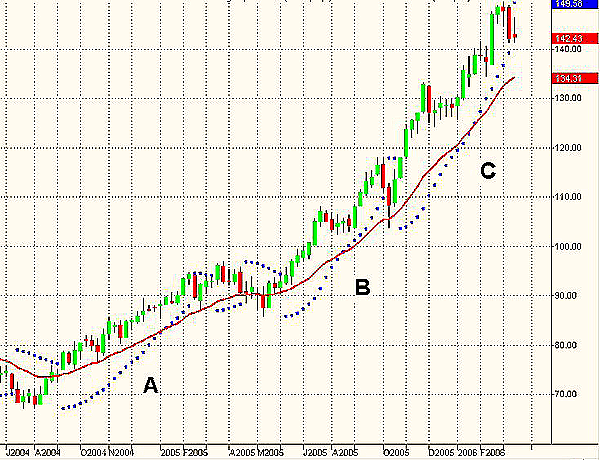
| In Figure 2, the weekly chart shows that prices have doubled since July 2004. The indicator I used, the stop-and-reverse (SAR) parabolic, helped identify the three main legs of the uptrend (A-B-C). The parabolic is derived mathematically from the parabolic curve. It provides two values: a sell number and a buy number. Penetration of the buy number means to go long and close short trades. The opposite is true for the sell number. The parabolic is very good at keeping you in a trend while prices explode in your direction. The problem is that it gets whipsawed in sideways or highly volatile markets. Basically, its limitations are similar to those of traditional moving averages. To avoid these issues, one solution is to consider using indicators that are not based on price. This week, the indicator has indicated a sell order, opening at best a consolidation area. |

|
| FIGURE 2: LEH, WEEKLY. Prices have doubled since 2004. An impressive uptrend has been printed, characterized by low volatility and few corrections. |
| Graphic provided by: TradeStation. |
| |
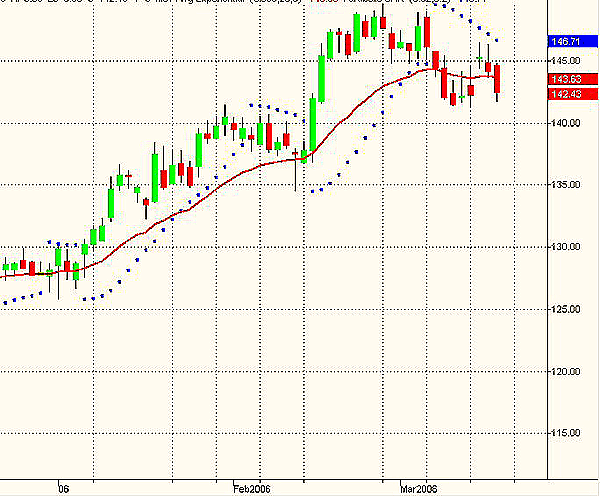
| On the news side, Lehman Brothers reported yesterday that earnings rose 24 percent in its fiscal first quarter on strong results from its investment banking and equities trading businesses. Earnings are $1.09 billion, or $3.66 a share, compared with $856 million, or $2.91 a share, in the period a year earlier, with a revenue in the period up 17 percent. Shares of LEH fell $1.15 to $144.15. The uptrend has been so stable that yesterday's performance should be due only to profit taking. In Figure 3, the daily chart shows that the sell order according to the SAR parabolic was given on March 7. Generally, I tend to follow this indicator's signals when they are in the direction of the prevailing trend. Therefore, in this case, I would not follow the reverse indications, but only close my long positions. |

|
| FIGURE 3: LEH, DAILY. The stock is moving to the downside to test the first supports. |
| Graphic provided by: TradeStation. |
| |
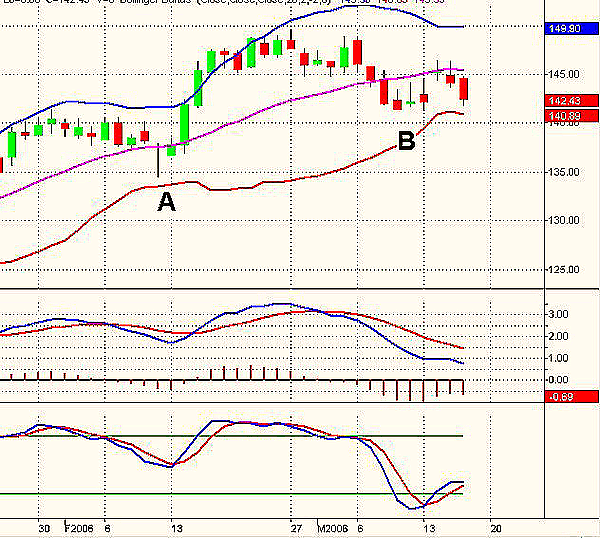
| In Figure 4, relatively flat Bollinger Bands indicate that so far the stock is not printing an impulse to the downside but rather are consolidating in a trading range type of environment. Similar indications are provided by the slow stochastic that has just left the oversold level and the moving average convergence/divergence (MACD) that is moving downward below its moving average, but the stock still has positive values. The stock's behavior in this phase may suggest a low-risk entry point in a low-volatility environment. This would allow a possible retest of recent highs. It is important to observe the stock's reaction at the test of its first supports at $134.54 (point A) and $141.37 (point B). Fast acceleration of prices through supports would indicate longer and deeper corrections ahead. |

|
| FIGURE 4: LEH, DAILY. Indicators display a consolidation environment. |
| Graphic provided by: TradeStation. |
| |
Author of the book "Trading the US Markets - A Comprehensive Guide to US Markets for International Traders and Investors" - Harriman House (July 2008)
| Address: | VIA ROBERTO AGO 26 POSTAL CODE 00166 |
| Rome, ITALY | |
| Phone # for sales: | +393357540708 |
| E-mail address: | pezzutti.paolo@tiscali.it |
Click here for more information about our publications!
Comments
Date: 03/18/06Rank: 3Comment:

Request Information From Our Sponsors
- StockCharts.com, Inc.
- Candle Patterns
- Candlestick Charting Explained
- Intermarket Technical Analysis
- John Murphy on Chart Analysis
- John Murphy's Chart Pattern Recognition
- John Murphy's Market Message
- MurphyExplainsMarketAnalysis-Intermarket Analysis
- MurphyExplainsMarketAnalysis-Visual Analysis
- StockCharts.com
- Technical Analysis of the Financial Markets
- The Visual Investor
- VectorVest, Inc.
- Executive Premier Workshop
- One-Day Options Course
- OptionsPro
- Retirement Income Workshop
- Sure-Fire Trading Systems (VectorVest, Inc.)
- Trading as a Business Workshop
- VectorVest 7 EOD
- VectorVest 7 RealTime/IntraDay
- VectorVest AutoTester
- VectorVest Educational Services
- VectorVest OnLine
- VectorVest Options Analyzer
- VectorVest ProGraphics v6.0
- VectorVest ProTrader 7
- VectorVest RealTime Derby Tool
- VectorVest Simulator
- VectorVest Variator
- VectorVest Watchdog
