HOT TOPICS LIST
- MACD
- Fibonacci
- RSI
- Gann
- ADXR
- Stochastics
- Volume
- Triangles
- Futures
- Cycles
- Volatility
- ZIGZAG
- MESA
- Retracement
- Aroon
INDICATORS LIST
LIST OF TOPICS
PRINT THIS ARTICLE
by Arthur Hill
The NASDAQ 100 Equal Weight Index looks stronger than its weighted brother, and both are poised to break out.
Position: Accumulate
Arthur Hill
Arthur Hill is currently editor of TDTrader.com, a website specializing in trading strategies, sector/industry specific breadth stats and overall technical analysis. He passed the Society of Technical Analysts (STA London) diploma exam with distinction is a Certified Financial Technician (CFTe). Prior to TD Trader, he was the Chief Technical Analyst for Stockcharts.com and the main contributor to the ChartSchool.
PRINT THIS ARTICLE
STOCHASTICS
A Look At The Equal Weight NASDAQ 100
03/16/06 10:31:23 AMby Arthur Hill
The NASDAQ 100 Equal Weight Index looks stronger than its weighted brother, and both are poised to break out.
Position: Accumulate
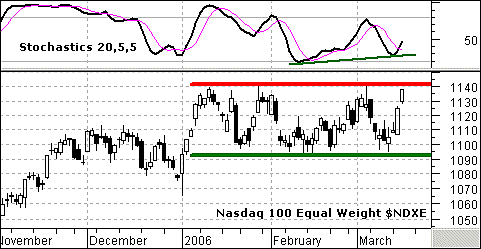
| As its name suggests, the NASDAQ 100 ($NDX) is made up of 100 NASDAQ stocks. The NASDAQ sets the individual stock weightings and does not disclose methodology (at least not for free!). In addition to the normal weighted NASDAQ 100, there is the NASDAQ 100 Equal Weight Index ($NDXE). As its name suggests, all stocks in that index are weighted equally, which makes that index a broader measure than its weighted counterpart. See Figure 1. |

|
| FIGURE 1: NASDAQ 100 EQUAL WEIGHT INDEX. In this index, as opposed to the original NASDAQ 100, all stocks are weighted equally, making it a broader measure. |
| Graphic provided by: MetaStock. |
| Graphic provided by: MS QuoteCenter. |
| |
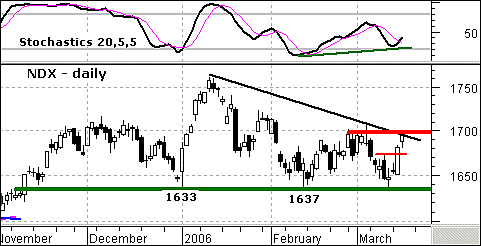
| The charts are also different. The January–February decline was deeper for the NASDAQ 100 than the NASDAQ 100 Equal Weight Index. While the NASDAQ 100 established a pretty clear downtrend in January and February, $NDXE traded flat and formed a consolidation. The index held well above the January low, and this shows relative strength among the not-so-great majority. My guess is that extreme weakness in name stocks like Google, Apple, Yahoo!, Intel, and others weighed on the NASDAQ 100 (Figure 2) more than they did on the $NDXE. |

|
| FIGURE 2: NASDAQ 100, DAILY. In this index, the stocks are weighted. |
| Graphic provided by: MetaStock. |
| Graphic provided by: MS QuoteCenter. |
| |
| Both indexes are on the verge of an important breakout. The $NDXE is challenging resistance from its January–March highs, and a break above 1140 would be bullish. In addition, note that the stochastic oscillator formed a positive divergence over the last five weeks and recently moved above its signal line. In a similar vein, $NDX is challenging resistance from the January trendline and the late February/early March highs. The stochastic oscillator also formed a positive divergence, and a break above 1700 would be most bullish for the index. |
Arthur Hill is currently editor of TDTrader.com, a website specializing in trading strategies, sector/industry specific breadth stats and overall technical analysis. He passed the Society of Technical Analysts (STA London) diploma exam with distinction is a Certified Financial Technician (CFTe). Prior to TD Trader, he was the Chief Technical Analyst for Stockcharts.com and the main contributor to the ChartSchool.
| Title: | Editor |
| Company: | TDTrader.com |
| Address: | Willem Geetsstraat 17 |
| Mechelen, B2800 | |
| Phone # for sales: | 3215345465 |
| Website: | www.tdtrader.com |
| E-mail address: | arthurh@tdtrader.com |
Traders' Resource Links | |
| TDTrader.com has not added any product or service information to TRADERS' RESOURCE. | |
Click here for more information about our publications!
Comments
Date: 03/16/06Rank: 4Comment:
Date: 03/16/06Rank: 5Comment:

Request Information From Our Sponsors
- VectorVest, Inc.
- Executive Premier Workshop
- One-Day Options Course
- OptionsPro
- Retirement Income Workshop
- Sure-Fire Trading Systems (VectorVest, Inc.)
- Trading as a Business Workshop
- VectorVest 7 EOD
- VectorVest 7 RealTime/IntraDay
- VectorVest AutoTester
- VectorVest Educational Services
- VectorVest OnLine
- VectorVest Options Analyzer
- VectorVest ProGraphics v6.0
- VectorVest ProTrader 7
- VectorVest RealTime Derby Tool
- VectorVest Simulator
- VectorVest Variator
- VectorVest Watchdog
- StockCharts.com, Inc.
- Candle Patterns
- Candlestick Charting Explained
- Intermarket Technical Analysis
- John Murphy on Chart Analysis
- John Murphy's Chart Pattern Recognition
- John Murphy's Market Message
- MurphyExplainsMarketAnalysis-Intermarket Analysis
- MurphyExplainsMarketAnalysis-Visual Analysis
- StockCharts.com
- Technical Analysis of the Financial Markets
- The Visual Investor
