HOT TOPICS LIST
- MACD
- Fibonacci
- RSI
- Gann
- ADXR
- Stochastics
- Volume
- Triangles
- Futures
- Cycles
- Volatility
- ZIGZAG
- MESA
- Retracement
- Aroon
INDICATORS LIST
LIST OF TOPICS
PRINT THIS ARTICLE
by David Penn
Resistance at the upper boundary of a trend channel sets up a short-term 2B top and a pullback in yields.
Position: N/A
David Penn
Technical Writer for Technical Analysis of STOCKS & COMMODITIES magazine, Working-Money.com, and Traders.com Advantage.
PRINT THIS ARTICLE
TREND-CHANNEL
Rate Rally Retreats At Resistance
03/15/06 01:46:27 PMby David Penn
Resistance at the upper boundary of a trend channel sets up a short-term 2B top and a pullback in yields.
Position: N/A
| Writing in one of his regular updates, trader and investment advisor Gary Kaltbaum noted that "the BOND MARKET has been getting hit hard ... but in recent days, everyone turned bearish on BONDS ... thus the bounce." It was a little over a month ago that I suggested that 10-year note rates were headed higher ("Return Of The Son Of Another Rate Rally," Traders.com Advantage; February 2, 2006). At the time, $TNX (the index proxy for the yield on the 10-year Treasury note) was at approximately 45.61, or 4.56%. Although that article focused on the note side of the ledger (as opposed to the yield side), the arguments made there are equally relevant here: a likely test of the November lows in notes (November highs in rates) meant that lower note prices and higher note yields were likely in the near term. |

|
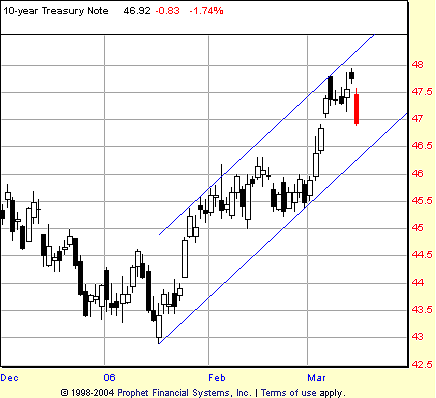
| FIGURE 1: 10-YEAR TREASURY NOTE YIELD, DAILY. Long-term interest rates broke out of a month-long consolidation to move sharply higher in early March. Note how the $TNX fell back on its initial attempt to break out above the upper boundary of the trendline that extends from the January lows. |
| Graphic provided by: Prophet Financial, Inc. |
| |
| The question that comes to mind at this point is whether the "bounce" of which Kaltbaum wrote is just that — a bounce — or if it is the beginning of a reversal in trend. In order for there to be a reversal in trend, there must be a trend to begin with. If we consider the two-month uptrend from the January lows, then it is clear that the bounce in notes (or pullback in yield) has yet to rise to the level of a reversal. At a minimum, that would require penetration of the trendline that has provided support for the January–March advance. We don't have that yet by any stretch of the imagination. What we do have so far is a very short-term 2B top (barely five days long) that is serving as a "marker" for the mid-March correction. Note that the move up from the month-long consolidation in February was an almost vertical one, and some correction is going to be necessary if this market is to continue moving higher, preferably at a less steep angle of ascent. |
| Writing about 2B tops, Victor Sperandeo — who introduced the concept in his book Methods Of A Wall Street Master — said, "When day-trading, the 2B criterion may be right only 50% of the time, but if you limit losses when you're wrong and let your profits run when you're right, you'll make a lot of money trading on this basis. The probabilities of success using the 2B in the intermediate term are much higher." What we have in Figure 1 is an in-between case: a 2B swing trade, if you will. As such, any gains from betting against the $TNX at this point should probably be taken quickly. This is all the more so in the context of the uptrend that remains intact. |

|
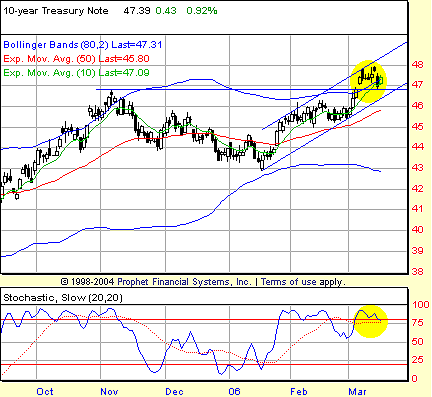
| FIGURE 2: 10-YEAR TREASURY NOTE YIELD, DAILY. The February consolidation helped tighten the Bollinger Bands in $TNX, acknowledging the sort of contraction in volatility that often presages a dramatic expansion. Note also how $TNX in early March gapped up over the November 2005 highs. That level, just south of 47 (or 4.7%), now stands as a potential support level. |
| Graphic provided by: Prophet Financial, Inc. |
| |
| There are additional reasons for being wary of any notions that this short-term 2B top will lead to significantly lower yields on the 10-year Treasury note. The January–March rally brought $TNX up to the level of the November 2005 highs, and then gapped $TNX up over those highs in a single bound. Even recent buying of bonds (shown in Figure 2 as "down days" for yields; recall that rising bond prices mean lower bond yields) has not brought yields back down below the level of the November 2005 highs. This is an important development. Given the strength suggested by the mid-March gap up and the inability of bond buyers to push rates back down (so far), the case for higher rates remains as strong as it has been at any point this year. |
| One way of measuring the might of a market that appears to be trending strongly (and especially those that appear to be trending "too strongly") is the BOSO screen I've adapted from the work of Price Headley (bigtrends.com) and have written about for Working-Money.com. That screen is shown in Figure 2. Essentially, $TNX made what I call a stochastic breakout in early March — a phenomenon that often anticipates a strongly bullish phase in which a market will become and remain overbought for a significant (read: tradable) amount of time. That last stochastic breakout occurred in late January just as the uptrend was getting under way. That breakout, as can be the case with the initial stochastic breakout in a new trend, was a minor loser (entry at 45.61 on February 1, exit at 45.31 on February 22). It will be worth watching to see if $TNX is able to ride its second stochastic breakout higher and more profitably than it did its first. |
Technical Writer for Technical Analysis of STOCKS & COMMODITIES magazine, Working-Money.com, and Traders.com Advantage.
| Title: | Technical Writer |
| Company: | Technical Analysis, Inc. |
| Address: | 4757 California Avenue SW |
| Seattle, WA 98116 | |
| Phone # for sales: | 206 938 0570 |
| Fax: | 206 938 1307 |
| Website: | www.Traders.com |
| E-mail address: | DPenn@traders.com |
Traders' Resource Links | |
| Charting the Stock Market: The Wyckoff Method -- Books | |
| Working-Money.com -- Online Trading Services | |
| Traders.com Advantage -- Online Trading Services | |
| Technical Analysis of Stocks & Commodities -- Publications and Newsletters | |
| Working Money, at Working-Money.com -- Publications and Newsletters | |
| Traders.com Advantage -- Publications and Newsletters | |
| Professional Traders Starter Kit -- Software | |
Click here for more information about our publications!
Comments
Date: 03/15/06Rank: 3Comment:

Request Information From Our Sponsors
- StockCharts.com, Inc.
- Candle Patterns
- Candlestick Charting Explained
- Intermarket Technical Analysis
- John Murphy on Chart Analysis
- John Murphy's Chart Pattern Recognition
- John Murphy's Market Message
- MurphyExplainsMarketAnalysis-Intermarket Analysis
- MurphyExplainsMarketAnalysis-Visual Analysis
- StockCharts.com
- Technical Analysis of the Financial Markets
- The Visual Investor
- VectorVest, Inc.
- Executive Premier Workshop
- One-Day Options Course
- OptionsPro
- Retirement Income Workshop
- Sure-Fire Trading Systems (VectorVest, Inc.)
- Trading as a Business Workshop
- VectorVest 7 EOD
- VectorVest 7 RealTime/IntraDay
- VectorVest AutoTester
- VectorVest Educational Services
- VectorVest OnLine
- VectorVest Options Analyzer
- VectorVest ProGraphics v6.0
- VectorVest ProTrader 7
- VectorVest RealTime Derby Tool
- VectorVest Simulator
- VectorVest Variator
- VectorVest Watchdog
