HOT TOPICS LIST
- MACD
- Fibonacci
- RSI
- Gann
- ADXR
- Stochastics
- Volume
- Triangles
- Futures
- Cycles
- Volatility
- ZIGZAG
- MESA
- Retracement
- Aroon
INDICATORS LIST
LIST OF TOPICS
PRINT THIS ARTICLE
by Gary Grosschadl
Broadening tops are a bearish formation, and the Dow industrials shows this pattern on its weekly chart.
Position: Sell
Gary Grosschadl
Independent Canadian equities trader and technical analyst based in Peterborough
Ontario, Canada.
PRINT THIS ARTICLE
BROADENING FORMATION
Dow's Dangerous Downside
03/14/06 09:43:21 AMby Gary Grosschadl
Broadening tops are a bearish formation, and the Dow industrials shows this pattern on its weekly chart.
Position: Sell
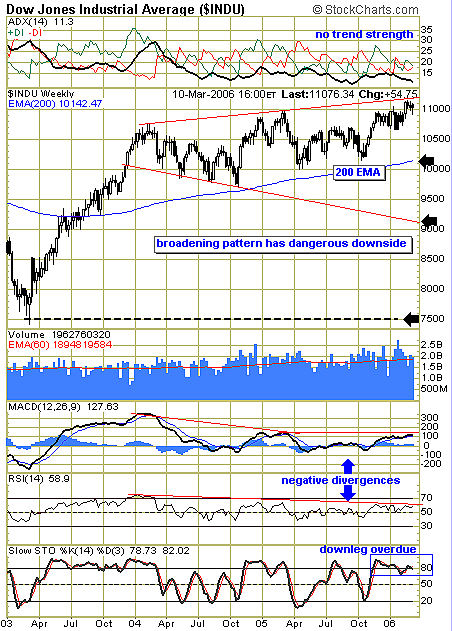
| The broadening top formation has a series of higher highs and lower lows and is considered fulfilled when it breaks to the downside, outside of the lower trendline. Because it is such a wide-reaching pattern, a mere touch or test of the lower trendline has substantial implications even without a downside break. Should a downside break occur, the height of the pattern subtracted from the downside breakout point gives you the approximate target. |
| However, the mitigating condition here is aptly shown by a powerful line of support: the 200-period exponential moving average (EMA) is currently at 10,142. We can easily conclude that as long as the Dow Jones Industrial Average (DJIA) remains above this often-watched harbinger of support, the uptrend is intact. Note how the upper trendline and the 200-day EMA roughly relates to a rising channel (Figure 1). But keep in mind the old saying that "what goes up must come down." |

|
| FIGURE 1: DOW JONES INDUSTRIAL AVERAGE, WEEKLY. This is a sobering view for the DJIA should the markets turn south. |
| Graphic provided by: StockCharts.com. |
| |
| As the DJIA is very near the top trendline, a lower test soon is a very real possibility. The magnitude of this test has a wide range of correction. The first line of potential strong support involves a drop of 934 points to the 200-day EMA. Support here would be bullish for another ride up to the top trendline. A trading strategy for this index could be to take profits near this top trendline and then reload when convincing support is found. Figure 1 suggests if the bears take control, then another 1,000-point drop could evolve, should the lower trendline come into play. Under super-bear conditions, the lower pattern fulfillment target becomes 7500. This deep retracement would test 2003's hammer bottom. |
| Several indicators are considered on this chart; note the weak trend displayed at the top graph showing the average directional movement index (ADX). This ongoing trend would suggest at best a sideways drift with the potential for an eventual downleg. The lower indicators are also cautionary. Both the moving average convergence/divergence (MACD) and the relative strength index (RSI) show a general negative divergence to the index's higher peaks forming the top trendline. Finally, the stochastic oscillator shows an overbought condition in the 80 area, hinting at an overdue downleg. |
| The view here is that there is more downside potential here than upside promise. Should the market's big-money players also take this view, then the downside has dangerous implications. Will the 200-day EMA hold? Stay tuned. |
Independent Canadian equities trader and technical analyst based in Peterborough
Ontario, Canada.
| Website: | www.whatsonsale.ca/financial.html |
| E-mail address: | gwg7@sympatico.ca |
Click here for more information about our publications!
Comments
Date: 03/14/06Rank: 5Comment:
Date: 03/14/06Rank: 5Comment:
Date: 03/18/06Rank: 4Comment:
Date: 03/27/06Rank: 5Comment:

Request Information From Our Sponsors
- StockCharts.com, Inc.
- Candle Patterns
- Candlestick Charting Explained
- Intermarket Technical Analysis
- John Murphy on Chart Analysis
- John Murphy's Chart Pattern Recognition
- John Murphy's Market Message
- MurphyExplainsMarketAnalysis-Intermarket Analysis
- MurphyExplainsMarketAnalysis-Visual Analysis
- StockCharts.com
- Technical Analysis of the Financial Markets
- The Visual Investor
- VectorVest, Inc.
- Executive Premier Workshop
- One-Day Options Course
- OptionsPro
- Retirement Income Workshop
- Sure-Fire Trading Systems (VectorVest, Inc.)
- Trading as a Business Workshop
- VectorVest 7 EOD
- VectorVest 7 RealTime/IntraDay
- VectorVest AutoTester
- VectorVest Educational Services
- VectorVest OnLine
- VectorVest Options Analyzer
- VectorVest ProGraphics v6.0
- VectorVest ProTrader 7
- VectorVest RealTime Derby Tool
- VectorVest Simulator
- VectorVest Variator
- VectorVest Watchdog
