HOT TOPICS LIST
- MACD
- Fibonacci
- RSI
- Gann
- ADXR
- Stochastics
- Volume
- Triangles
- Futures
- Cycles
- Volatility
- ZIGZAG
- MESA
- Retracement
- Aroon
INDICATORS LIST
LIST OF TOPICS
PRINT THIS ARTICLE
by Gary Grosschadl
Imperial Oil Ltd.'s daily chart suggests an upleg has begun.
Position: Buy
Gary Grosschadl
Independent Canadian equities trader and technical analyst based in Peterborough
Ontario, Canada.
PRINT THIS ARTICLE
SYMMETRICAL TRIANGLE
Canadian Oil & Gas Giant Tries A Bounce
03/13/06 08:26:05 AMby Gary Grosschadl
Imperial Oil Ltd.'s daily chart suggests an upleg has begun.
Position: Buy
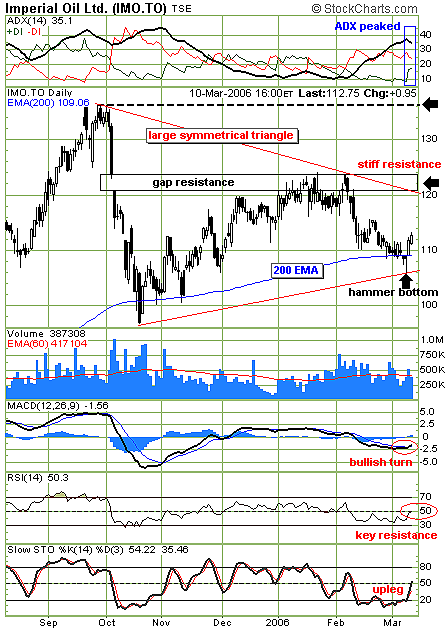
| With a recent bottom hammer candlestick, a large symmetrical triangle can be drawn (Figure 1). Note the similar sloppy bounce off the 200-day exponential moving average (EMA) from last October. That last upleg was halted by previous gap resistance, and this is likely to be repeated as a confluence of resistance. |
| Stiff resistance is expected just beyond the upper trendline, making this a likely short-term speculative buy signal. This resistance comes in the form of a previous congestion zone and previous gap resistance $121-124. Failure here could have this triangle pattern continue, as another move off the lower trendline would tighten the formation. This would be the potentially bigger and safer play. |

|
| FIGURE 1: IMPERIAL OIL, DAILY. Imperial Oil forms a large triangle pattern. |
| Graphic provided by: StockCharts.com. |
| |
| Several indicators are worthy of mention. The directional movement indicator at the top of the chart shows three components interacting. The average directional index (ADX) represents trend strength. It is coming off a peak suggesting that the previous bearish trend is reversing. If so, this will eventually be confirmed by a crossing over of the directional indicators: +DI, representing bullish power, and -DI, representing bearish power, have started to converge. When +DI rides above -DI (accompanied by ADX above 20), the bulls are in charge. |
| The indicators below the chart also show bullish promise. The moving average convergence/divergence (MACD) shows a bullish turn in the making, while relative strength index (RSI) tries to move past often key resistance at its 50 level. The stochastics oscillator shows its own upleg on the move. |
| Should oil prices surge higher into new highs or this company announce bullish developments, then a stronger move could evolve. The result could be a bold move past the top trendline, breaking gap resistance. Then the upside target becomes the previous high of $136. Only time will tell. |
Independent Canadian equities trader and technical analyst based in Peterborough
Ontario, Canada.
| Website: | www.whatsonsale.ca/financial.html |
| E-mail address: | gwg7@sympatico.ca |
Click here for more information about our publications!
Comments
Date: 03/14/06Rank: 5Comment:

Request Information From Our Sponsors
- StockCharts.com, Inc.
- Candle Patterns
- Candlestick Charting Explained
- Intermarket Technical Analysis
- John Murphy on Chart Analysis
- John Murphy's Chart Pattern Recognition
- John Murphy's Market Message
- MurphyExplainsMarketAnalysis-Intermarket Analysis
- MurphyExplainsMarketAnalysis-Visual Analysis
- StockCharts.com
- Technical Analysis of the Financial Markets
- The Visual Investor
- VectorVest, Inc.
- Executive Premier Workshop
- One-Day Options Course
- OptionsPro
- Retirement Income Workshop
- Sure-Fire Trading Systems (VectorVest, Inc.)
- Trading as a Business Workshop
- VectorVest 7 EOD
- VectorVest 7 RealTime/IntraDay
- VectorVest AutoTester
- VectorVest Educational Services
- VectorVest OnLine
- VectorVest Options Analyzer
- VectorVest ProGraphics v6.0
- VectorVest ProTrader 7
- VectorVest RealTime Derby Tool
- VectorVest Simulator
- VectorVest Variator
- VectorVest Watchdog
