HOT TOPICS LIST
- MACD
- Fibonacci
- RSI
- Gann
- ADXR
- Stochastics
- Volume
- Triangles
- Futures
- Cycles
- Volatility
- ZIGZAG
- MESA
- Retracement
- Aroon
INDICATORS LIST
LIST OF TOPICS
PRINT THIS ARTICLE
by Paolo Pezzutti
Prices are testing the 2004 high.
Position: N/A
Paolo Pezzutti
Author of the book "Trading the US Markets - A Comprehensive Guide to US Markets for International Traders and Investors" - Harriman House (July 2008)
PRINT THIS ARTICLE
TECHNICAL ANALYSIS
CBOE 10-Year Treasury Note Is In A Short-Term Congestion
03/10/06 02:54:53 PMby Paolo Pezzutti
Prices are testing the 2004 high.
Position: N/A
| US Treasury prices sent yields higher after an auction of $8 billion in new 10-year notes attracted only minor interest from foreign central banks. On Friday, March 10, the release of the US employment report for February provided indications about the strength of the labor market and wage inflation. Overall, the Treasury market pushed yields up to levels attractive enough to lure investors to the fixed-income market. It is likely that the Federal Reserve and foreign central banks will be forced to keep lifting rates to control inflation. Overnight, the Bank of Japan put in place some changes to its monetary policy. They will leave in place its zero interest policy, but change its liquidity targets. In addition, the European Central Bank recently signaled that it also may become more aggressive on rates this year. |

|
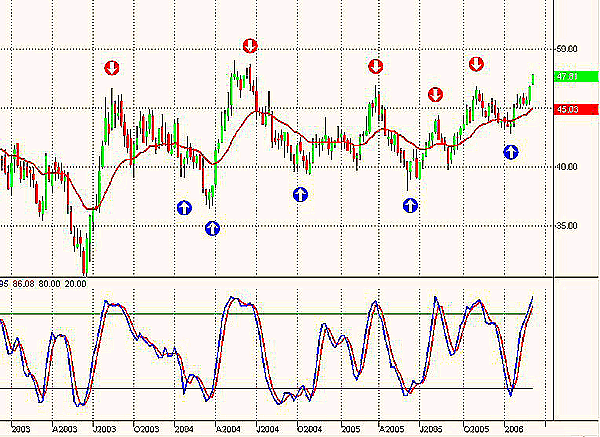
| FIGURE 1: $TNX, MONTHLY. $TNX has been moving sideways during the past three years. Oscillators worked well during this phase. |
| Graphic provided by: TradeStation. |
| |
| On the technical analysis side, the 10-year Treasury note has reached the July 2004 level at 47.60. As you can see in Figure 1, prices have been moving sideways since 2003, bouncing between support and resistance. In this environment, the stochastic slow has provided good trading indications so far when oversold and overbought. At the moment, prices are in the upper range with the oscillator overbought and have gained momentum to the upside. |

|
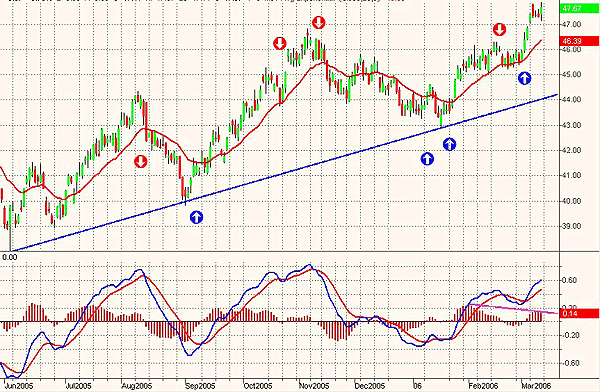
| FIGURE 2: $TNX, DAILY. Prices developed big swings, moving upward sustained by a rising trendline. |
| Graphic provided by: TradeStation. |
| |
| At the daily level in Figure 2, you can see that a rising trendline is supporting the move to the upside of yields. The uptrend in this time frame started in June 2005. The swings have been deep, providing good trading opportunities. The moving average convergence/divergence (MACD) in this time frame has given good indications with few false signals. |

|
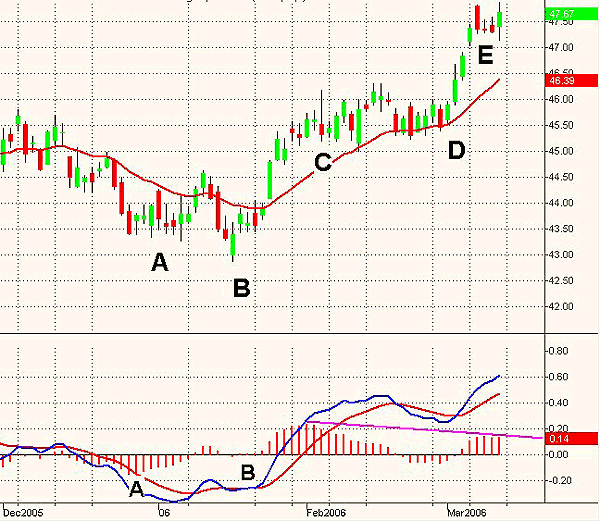
| FIGURE 3: $TNX, DAILY. Prices are now in a congestion after a two-month upleg. |
| Graphic provided by: TradeStation. |
| |
| Prices are now in the upper part of the range with an increased risk for traders who take long trades. In Figure 3, you can see that at the end of 2005 at point A, prices printed a relative low characterized by a positive divergence of MACDiff. The difference between MACD and MACD average is plotted as the MACDiff (red histogram). Point B printed a significant positive divergence of both MACD and MACDiff. This signal provided an excellent entry point, picking the January low at about 43. Point C on February 3 marked the measuring bar of a congestion that developed for 18 bars. Point D signaled the breakout to the upside, with the MACD providing a crossing to the upside. On March 7 (point E), the trading session opened higher only to close lower within the previous day's range and trapping long hands. This bar represents the beginning of another congestion. The MACD is positive, but MACDiff is printing a negative divergence. |
| It is difficult to say if the breakout of the ongoing short-term congestion will result in a continuation of the uptrend or, rather, in the beginning of a consolidation phase. Normally, you would consider it a pause in the uptrend. However, it is also true that risk is getting higher at these excess levels, as the still-overbought stochastic oscillator shows. If you want to take this trade, be aware that the breakout to the upside presents more risks. |
Author of the book "Trading the US Markets - A Comprehensive Guide to US Markets for International Traders and Investors" - Harriman House (July 2008)
| Address: | VIA ROBERTO AGO 26 POSTAL CODE 00166 |
| Rome, ITALY | |
| Phone # for sales: | +393357540708 |
| E-mail address: | pezzutti.paolo@tiscali.it |
Click here for more information about our publications!
Comments
Date: 03/14/06Rank: 3Comment:

Request Information From Our Sponsors
- StockCharts.com, Inc.
- Candle Patterns
- Candlestick Charting Explained
- Intermarket Technical Analysis
- John Murphy on Chart Analysis
- John Murphy's Chart Pattern Recognition
- John Murphy's Market Message
- MurphyExplainsMarketAnalysis-Intermarket Analysis
- MurphyExplainsMarketAnalysis-Visual Analysis
- StockCharts.com
- Technical Analysis of the Financial Markets
- The Visual Investor
- VectorVest, Inc.
- Executive Premier Workshop
- One-Day Options Course
- OptionsPro
- Retirement Income Workshop
- Sure-Fire Trading Systems (VectorVest, Inc.)
- Trading as a Business Workshop
- VectorVest 7 EOD
- VectorVest 7 RealTime/IntraDay
- VectorVest AutoTester
- VectorVest Educational Services
- VectorVest OnLine
- VectorVest Options Analyzer
- VectorVest ProGraphics v6.0
- VectorVest ProTrader 7
- VectorVest RealTime Derby Tool
- VectorVest Simulator
- VectorVest Variator
- VectorVest Watchdog
