HOT TOPICS LIST
- MACD
- Fibonacci
- RSI
- Gann
- ADXR
- Stochastics
- Volume
- Triangles
- Futures
- Cycles
- Volatility
- ZIGZAG
- MESA
- Retracement
- Aroon
INDICATORS LIST
LIST OF TOPICS
PRINT THIS ARTICLE
by Koos van der Merwe
Newmont Mining is the largest gold mine in the world at the moment. By studying its chart, can we determine gold's movement?
Position: Accumulate
Koos van der Merwe
Has been a technical analyst since 1969, and has worked as a futures and options trader with First Financial Futures in Johannesburg, South Africa.
PRINT THIS ARTICLE
HEAD & SHOULDERS
Is Newmont Mining A Signpost For Gold?
03/10/06 08:56:04 AMby Koos van der Merwe
Newmont Mining is the largest gold mine in the world at the moment. By studying its chart, can we determine gold's movement?
Position: Accumulate
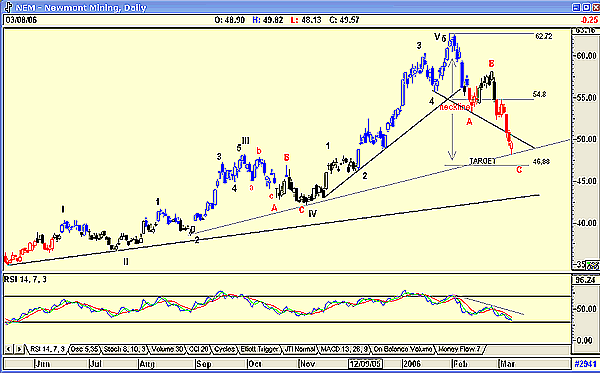
| The first chart is a daily chart of Newmont Mining (NEM). Note that the C-wave of the Elliott wave count is within the fourth wave of lesser degree. A target of $46.88 is suggested by the head & shoulder pattern that has formed. This target is determined as follows: From the top of wave 5 to the neckline is $62.72 - $54.80 = $7.92. Subtract this from $54.80 - $7.92 = $46.88. The price of NEM closed at $49.57 on March 8. This is close to our target of $46.88, which means that allowing for a reasonable margin of error, the price of Newmont could start moving up at any time. The relative strength index (RSI), however, suggests that there is still some downside left, so the target of $46.88, if not slightly lower, seems very likely. What would cause the price to move? The most likely scenario would be a rise in the price of gold. |

|
| FIGURE 1: NEWMONT MINING, DAILY. Note that the C-wave of the Elliott wave count is within the fourth wave of lesser degree. |
| Graphic provided by: AdvancedGET. |
| |
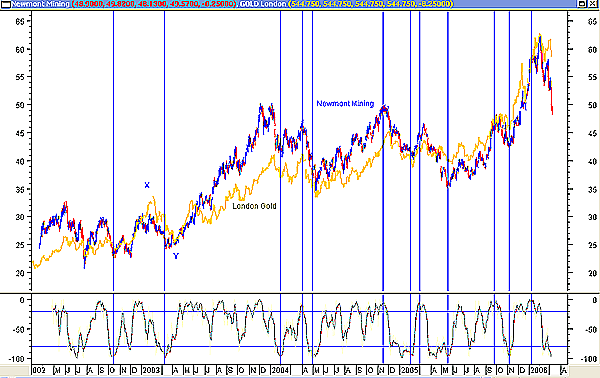
| Figure 2 is of NEM with London gold superimposed. Note how closely the two track each other in their turning points. Obviously, the depth of a rise or fall differs, and in some instances Newmont will actually precede London gold in its movement. Finally, note the indicator shown. This is Williams' %R with a 25 parameter. The indicator is below the -20 horizontal line, suggesting that a rise is imminent. |

|
| FIGURE 2: NEWMONT MINING AND LONDON GOLD. Note how closely the two track each other in their turning points. Could a rise be forthcoming? |
| Graphic provided by: MetaStock. |
| |
| To conclude, I would be a buyer of NEM as it moves up from the target of $46.88. When it occurs, the move up will most likely anticipate or move with a rise in the gold price, suggesting that as the share price approaches the target, we can analyze other gold shares in anticipation of a rise. Finally, remember that the Elliott wave count is suggesting a major upward impulse wave is in the offing. After wave C comes an upward moving wave 1 of a five-wave count, which will take both Newmont, and other gold shares, for that matter, to new highs as gold itself makes new highs. |
Has been a technical analyst since 1969, and has worked as a futures and options trader with First Financial Futures in Johannesburg, South Africa.
| Address: | 3256 West 24th Ave |
| Vancouver, BC | |
| Phone # for sales: | 6042634214 |
| E-mail address: | petroosp@gmail.com |
Click here for more information about our publications!
Comments
Date: 03/11/06Rank: 2Comment:

Request Information From Our Sponsors
- StockCharts.com, Inc.
- Candle Patterns
- Candlestick Charting Explained
- Intermarket Technical Analysis
- John Murphy on Chart Analysis
- John Murphy's Chart Pattern Recognition
- John Murphy's Market Message
- MurphyExplainsMarketAnalysis-Intermarket Analysis
- MurphyExplainsMarketAnalysis-Visual Analysis
- StockCharts.com
- Technical Analysis of the Financial Markets
- The Visual Investor
- VectorVest, Inc.
- Executive Premier Workshop
- One-Day Options Course
- OptionsPro
- Retirement Income Workshop
- Sure-Fire Trading Systems (VectorVest, Inc.)
- Trading as a Business Workshop
- VectorVest 7 EOD
- VectorVest 7 RealTime/IntraDay
- VectorVest AutoTester
- VectorVest Educational Services
- VectorVest OnLine
- VectorVest Options Analyzer
- VectorVest ProGraphics v6.0
- VectorVest ProTrader 7
- VectorVest RealTime Derby Tool
- VectorVest Simulator
- VectorVest Variator
- VectorVest Watchdog
