HOT TOPICS LIST
- MACD
- Fibonacci
- RSI
- Gann
- ADXR
- Stochastics
- Volume
- Triangles
- Futures
- Cycles
- Volatility
- ZIGZAG
- MESA
- Retracement
- Aroon
INDICATORS LIST
LIST OF TOPICS
PRINT THIS ARTICLE
by David Penn
The correction in the US dollar since November 2005 looks to be more than halfway completed.
Position: N/A
David Penn
Technical Writer for Technical Analysis of STOCKS & COMMODITIES magazine, Working-Money.com, and Traders.com Advantage.
PRINT THIS ARTICLE
ELLIOTT WAVE
A Working Wave Count For The Greenback
03/10/06 08:02:24 AMby David Penn
The correction in the US dollar since November 2005 looks to be more than halfway completed.
Position: N/A
| Shortly after the first of the year, a reader wrote in asking my opinion on the most likely wave count for the euro. That request has stymied me for some time — partly because I've been focused more on BOSO and my MACD histogram-related methods and less so on Elliott wave. But while it may be true that you can take the technician out of the wave theory, it is no less true that you can never really take the wave theory out of the technician. |

|
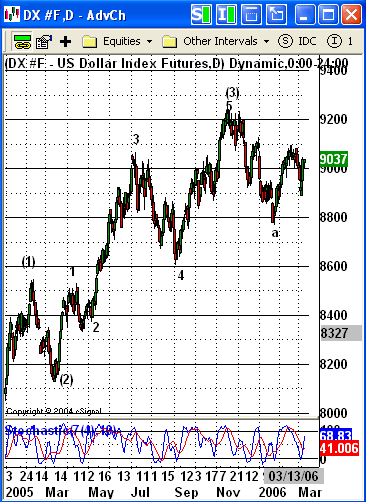
| FIGURE 1: US DOLLAR INDEX FUTURES, DAILY. This wave count suggests that the correction that began in November is part of a fourth-wave correction. Because the previous fourth-wave correction over the summer of 2005 was a sharp decline, the current larger-degree fourth-wave correction is more likely to be sideways than sharply lower. |
| Graphic provided by: eSignal. |
| |
| Rather than looking at the euro, however, I wanted to focus on the US dollar, the fortunes of which should provide some guidance not only for those looking to trade the euro, but also for those looking to trade other dollar-sensitive assets such as gold and silver, interest rates, bonds, and notes. It is the dollar's bull market since the autumn of 2004 that was once the object of much obsession, concern, and consternation. The fact that so many seem to have stopped paying attention to it only underscores my reasons for wanting to turn my attentions toward the greenback. |
| As Figure 1 shows, it appears as if the greenback is working its way higher after establishing a wave 3 peak in the autumn of 2005. Since that peak, the dollar has moved lower, but the rally since late January helps establish the fact that the correction over the past few months has been more of a trading range than the sort of capital-crushing vertical decline of more harsh corrections (including the correction over the summer of 2005). |

|
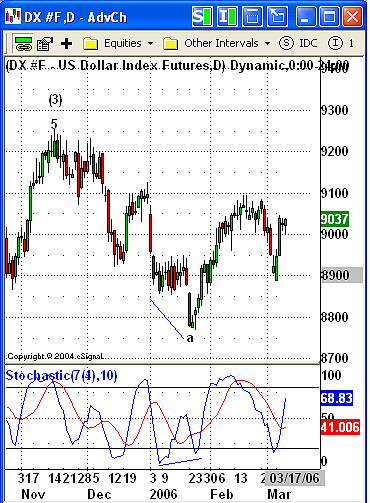
| FIGURE 2: US DOLLAR INDEX FUTURES, DAILY. Note the positive divergence at the wave a low in late January. This divergence likely signals a true bottom, and further suggests that the first leg of the correction that began in November has been completed. |
| Graphic provided by: eSignal. |
| |
| It appears as if the first leg of the correction has come to an end in late January. The positive divergence noted in Figure 2 is one strong piece of evidence to that effect. In the context of the correction, then, wave a of the three-legged, ABC correction, is complete and wave b of the correction is now under way. In fact, insofar as the B-part of any ABC correction always consists of three waves, it further seems that the wave b is a little over halfway completed itself. The bounce from late January to mid-February represents the first third of wave b, the drop from mid-February to early March appears to represent the second third of wave b, and the sharp move higher in early March appears to be the beginning of the third third of wave b. |
| Those of you who are familiar with Elliott wave theory might recall that "third of thirds" tend to be particularly powerful waves, regardless of context. Thus, traders and speculators should not be surprised if the sharpness of the dollar's March bounce so far is matched by near-vertical follow-through to the upside as the middle part of the fourth wave correction continues to run its course. |
Technical Writer for Technical Analysis of STOCKS & COMMODITIES magazine, Working-Money.com, and Traders.com Advantage.
| Title: | Technical Writer |
| Company: | Technical Analysis, Inc. |
| Address: | 4757 California Avenue SW |
| Seattle, WA 98116 | |
| Phone # for sales: | 206 938 0570 |
| Fax: | 206 938 1307 |
| Website: | www.Traders.com |
| E-mail address: | DPenn@traders.com |
Traders' Resource Links | |
| Charting the Stock Market: The Wyckoff Method -- Books | |
| Working-Money.com -- Online Trading Services | |
| Traders.com Advantage -- Online Trading Services | |
| Technical Analysis of Stocks & Commodities -- Publications and Newsletters | |
| Working Money, at Working-Money.com -- Publications and Newsletters | |
| Traders.com Advantage -- Publications and Newsletters | |
| Professional Traders Starter Kit -- Software | |
Click here for more information about our publications!
Comments
Date: 03/11/06Rank: 3Comment:

Request Information From Our Sponsors
- StockCharts.com, Inc.
- Candle Patterns
- Candlestick Charting Explained
- Intermarket Technical Analysis
- John Murphy on Chart Analysis
- John Murphy's Chart Pattern Recognition
- John Murphy's Market Message
- MurphyExplainsMarketAnalysis-Intermarket Analysis
- MurphyExplainsMarketAnalysis-Visual Analysis
- StockCharts.com
- Technical Analysis of the Financial Markets
- The Visual Investor
- VectorVest, Inc.
- Executive Premier Workshop
- One-Day Options Course
- OptionsPro
- Retirement Income Workshop
- Sure-Fire Trading Systems (VectorVest, Inc.)
- Trading as a Business Workshop
- VectorVest 7 EOD
- VectorVest 7 RealTime/IntraDay
- VectorVest AutoTester
- VectorVest Educational Services
- VectorVest OnLine
- VectorVest Options Analyzer
- VectorVest ProGraphics v6.0
- VectorVest ProTrader 7
- VectorVest RealTime Derby Tool
- VectorVest Simulator
- VectorVest Variator
- VectorVest Watchdog
