HOT TOPICS LIST
- MACD
- Fibonacci
- RSI
- Gann
- ADXR
- Stochastics
- Volume
- Triangles
- Futures
- Cycles
- Volatility
- ZIGZAG
- MESA
- Retracement
- Aroon
INDICATORS LIST
LIST OF TOPICS
PRINT THIS ARTICLE
by Sharon Yamanaka
For those who like to trade the small cap stocks, JDS Uniphase looks like it's trading like a small up and coming company.
Position: N/A
Sharon Yamanaka
PRINT THIS ARTICLE
CHART ANALYSIS
JDSU On The Rise
03/10/06 08:50:58 AMby Sharon Yamanaka
For those who like to trade the small cap stocks, JDS Uniphase looks like it's trading like a small up and coming company.
Position: N/A
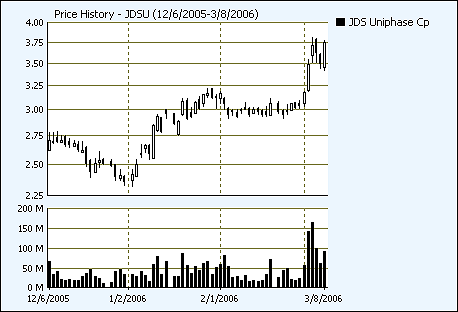
| This chart (Figure 1) caught my eye because of the single digit price, breakout pattern, and the high volume - all more characterisitic of a 6 million, not 6 billion cap. company. I've been looking for breakouts like this, but not among the highly traded or large cap companies such as JDSU- and JDSU was also one of the biggest losers in the Dotcom bust. Although not a dotcom company, as a provider of fiber optic equipment, JDSU is in the telecom industry that suffered greatly in the downfall of the Internet startups, going from a high of $140 to lows in the one dollar range. But in 2006, the telecom sector has been on the rise. Six months ago it was ranked 144 and now it's just broken into the top ten. |

|
| FIGURE 1: JDSU, DAILY. Not only are the long white candlesticks and the low price impressive, but the volume on the breakout as well. |
| Graphic provided by: MSN Money. |
| |
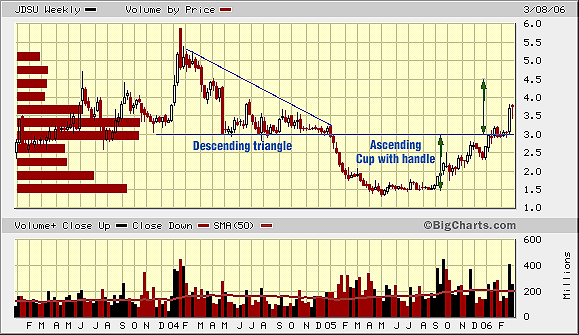
| As a larger, more stable company, JDSU would be less risky than the small caps. In addition, JDSU has been following the rules of technical analysis. Having also just broken above their 52-week high on strong volume, Figure 2 shows two consecutive chart patterns that give credence to the breakout. On forming a descending triangle in 2004, the theory would call for a price drop equal to the height of the triangle. And JDSU's price did indeed fall almost $2. |

|
| FIGURE 2: JDSU, FOUR-YEAR WEEKLY. Two consecutive chart patterns shown here give credence to the breakout. |
| Graphic provided by: BigCharts.com. |
| |
| In 2005 JDSU formed another classic formation, the cup-with-handle, and has just broken out of the $3 top on strong volume, the $3 top also being the 52-week high and a support/resistance area as seen by the increased volume at that level. Volume also confirms the patterns, rising at peaks and leveling out at the mid-areas. All of these are strong technical signals that seem to give more reliability -inevitability- to the "suggests the stock will" phrase that generally follows a technical setup. Finally, JDSU should have a target of $4.5-$5, based on the height of the cup. Although no guarantee that it will continue, it's nice when things work the way they're supposed to. |
| In 2005 JDSU formed another classic formation, the cup-with-handle, and has just broken out of the $3 top on strong volume, the $3 top also being the 52-week high and a support/resistance area as seen by the increased volume at that level. Volume also confirms the patterns, rising at peaks and leveling out at the mid-areas. All of these are strong technical signals that seem to give more reliability -inevitability- to the "suggests the stock will" phrase that generally follows a technical setup. Finally, JDSU should have a target of $4.5-$5, based on the height of the cup. Although I have to say that it's no guarantee things will continue, it's nice when things work the way they're supposed to. |
| Title: | Staff writer |
| Company: | Technical Analysis, Inc. |
| Website: | www.traders.com |
| E-mail address: | syamanaka@traders.com |
Traders' Resource Links | |
| Charting the Stock Market: The Wyckoff Method -- Books | |
| Working-Money.com -- Online Trading Services | |
| Traders.com Advantage -- Online Trading Services | |
| Technical Analysis of Stocks & Commodities -- Publications and Newsletters | |
| Working Money, at Working-Money.com -- Publications and Newsletters | |
| Traders.com Advantage -- Publications and Newsletters | |
| Professional Traders Starter Kit -- Software | |
Click here for more information about our publications!
Comments
Date: 03/11/06Rank: 4Comment:

Request Information From Our Sponsors
- VectorVest, Inc.
- Executive Premier Workshop
- One-Day Options Course
- OptionsPro
- Retirement Income Workshop
- Sure-Fire Trading Systems (VectorVest, Inc.)
- Trading as a Business Workshop
- VectorVest 7 EOD
- VectorVest 7 RealTime/IntraDay
- VectorVest AutoTester
- VectorVest Educational Services
- VectorVest OnLine
- VectorVest Options Analyzer
- VectorVest ProGraphics v6.0
- VectorVest ProTrader 7
- VectorVest RealTime Derby Tool
- VectorVest Simulator
- VectorVest Variator
- VectorVest Watchdog
- StockCharts.com, Inc.
- Candle Patterns
- Candlestick Charting Explained
- Intermarket Technical Analysis
- John Murphy on Chart Analysis
- John Murphy's Chart Pattern Recognition
- John Murphy's Market Message
- MurphyExplainsMarketAnalysis-Intermarket Analysis
- MurphyExplainsMarketAnalysis-Visual Analysis
- StockCharts.com
- Technical Analysis of the Financial Markets
- The Visual Investor
