HOT TOPICS LIST
- MACD
- Fibonacci
- RSI
- Gann
- ADXR
- Stochastics
- Volume
- Triangles
- Futures
- Cycles
- Volatility
- ZIGZAG
- MESA
- Retracement
- Aroon
INDICATORS LIST
LIST OF TOPICS
PRINT THIS ARTICLE
by David Penn
A bearish flag sets the stage for lower lows in crude in the spring of 2006.
Position: N/A
David Penn
Technical Writer for Technical Analysis of STOCKS & COMMODITIES magazine, Working-Money.com, and Traders.com Advantage.
PRINT THIS ARTICLE
TREND-CHANNEL
How Low Can Crude Go?
03/10/06 07:48:54 AMby David Penn
A bearish flag sets the stage for lower lows in crude in the spring of 2006.
Position: N/A
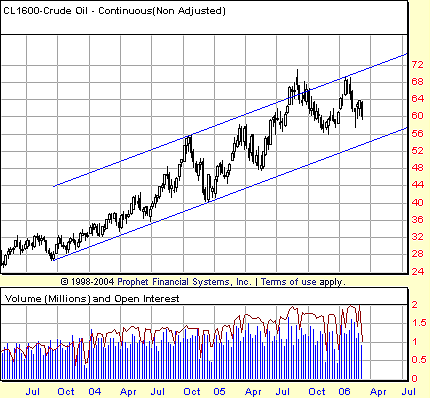
| When I last looked at crude oil ("Crude Comes In [Again]," Traders.com Advantage; February 7, 2006), I posited the futures as short-term weak, but still strong on a longer-term basis. From the point of view of the secular bull market in crude oil that began with the lows of earliest 1999, crude oil experienced an acceleration in late 2004 and early 2005 that saw the futures break free from a "stage 1" trend channel. The new "stage 2" trend channel is shown in Figure 1 and stems from the correction lows of 2003. |

|
| FIGURE 1: CRUDE OIL CONTINUOUS FUTURES, WEEKLY. Save for a period of panic late in the summer of 2005, crude oil futures have been well-contained within a trend channel since the autumn of 2003. |
| Graphic provided by: Prophet Financial, Inc. |
| |
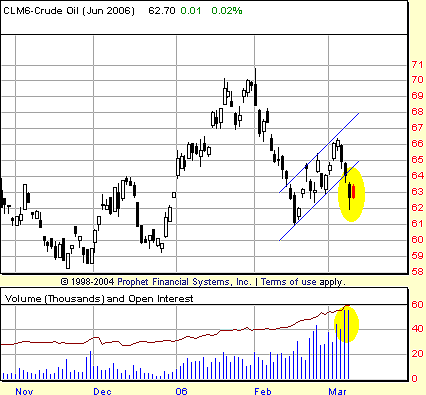
| This may prove to be the key perspective to maintain, as falling crude prices in the short and intermediate term provide a boost to stock-buying sentiment, and are taken to reflect a slackening in geopolitical tensions as well. We in the West should be so fortunate, for there is nothing in the current declines in crude oil that — so far — negates the longer-term bullishness of black gold. For the moment, let's affirm the bearishness of the near term. It appears as if a bearish flag has developed over the course of crude oil's decline from intraday prints north of 70 (basis June) to intraday prints near 61. The bearish flag, as Thomas Bulkowski points out in the second edition of his Encyclopedia Of Chart Patterns: |
Small flags appear like road kill along the price highway. You find them in a fast moving price trend, one that zips several points in just a few days. Price pauses at the flag and then continues in the same direction as before encountering the flag. That behavior is not always the case, of course, as price reversals abound, so you should wait for the breakout to be sure. That breakout looks to have taken place with the gap down on big volume on March 8. While the shape of the candlestick of that session (see Figure 2) shows us that buyers were able to push the market back up from its lows before the session ended, the technical damage appears to have been done. Until that gap is exceeded on the upside, it will be the bears that will have the bulls on the run. |

|
| FIGURE 2: JUNE CRUDE OIL FUTURES, DAILY. The measurement rule for this 14-day bearish flag suggests a minimum downside target near $57. |
| Graphic provided by: Prophet Financial, Inc. |
| |
| How low might June crude go? The measurement rule for flags calls for taking the distance from the beginning of the move to the beginning of the flag — here 70 and 61, respectively — and subtracting that distance from the end of the flag. Thus, we subtract a distance of 9 from the value of 66 at the top of the flag. That provides for a minimum downside target of about 57 (see Figure 2). Such a decline would represent new contract lows for June 2006 crude oil futures. The current contract low is approximately 58.25 from November 2005. |
| But what would such a decline mean for the overall cyclical bull trend shown in Figure 1? If we look at a daily chart of continuous futures, then we can see that the same sort of bearish flag is also present — although the values are different. There we have a 10-point flag subtracted from a flag top value of approximately 64. This provides for an initial downside target of 54 and, as Figure 1 shows, a likely rendezvous with long-term support in the form of the multimonth trendline from the October 2003 lows. |
Technical Writer for Technical Analysis of STOCKS & COMMODITIES magazine, Working-Money.com, and Traders.com Advantage.
| Title: | Technical Writer |
| Company: | Technical Analysis, Inc. |
| Address: | 4757 California Avenue SW |
| Seattle, WA 98116 | |
| Phone # for sales: | 206 938 0570 |
| Fax: | 206 938 1307 |
| Website: | www.Traders.com |
| E-mail address: | DPenn@traders.com |
Traders' Resource Links | |
| Charting the Stock Market: The Wyckoff Method -- Books | |
| Working-Money.com -- Online Trading Services | |
| Traders.com Advantage -- Online Trading Services | |
| Technical Analysis of Stocks & Commodities -- Publications and Newsletters | |
| Working Money, at Working-Money.com -- Publications and Newsletters | |
| Traders.com Advantage -- Publications and Newsletters | |
| Professional Traders Starter Kit -- Software | |
Click here for more information about our publications!
Comments
Date: 03/11/06Rank: 3Comment:

Request Information From Our Sponsors
- StockCharts.com, Inc.
- Candle Patterns
- Candlestick Charting Explained
- Intermarket Technical Analysis
- John Murphy on Chart Analysis
- John Murphy's Chart Pattern Recognition
- John Murphy's Market Message
- MurphyExplainsMarketAnalysis-Intermarket Analysis
- MurphyExplainsMarketAnalysis-Visual Analysis
- StockCharts.com
- Technical Analysis of the Financial Markets
- The Visual Investor
- VectorVest, Inc.
- Executive Premier Workshop
- One-Day Options Course
- OptionsPro
- Retirement Income Workshop
- Sure-Fire Trading Systems (VectorVest, Inc.)
- Trading as a Business Workshop
- VectorVest 7 EOD
- VectorVest 7 RealTime/IntraDay
- VectorVest AutoTester
- VectorVest Educational Services
- VectorVest OnLine
- VectorVest Options Analyzer
- VectorVest ProGraphics v6.0
- VectorVest ProTrader 7
- VectorVest RealTime Derby Tool
- VectorVest Simulator
- VectorVest Variator
- VectorVest Watchdog
