

HOT TOPICS LIST
- MACD
- Fibonacci
- RSI
- Gann
- ADXR
- Stochastics
- Volume
- Triangles
- Futures
- Cycles
- Volatility
- ZIGZAG
- MESA
- Retracement
- Aroon
INDICATORS LIST
LIST OF TOPICS
PRINT THIS ARTICLE
by David Penn
The Dow industrials and transports set spring goals in their late February retreat from year-to-date highs.
Position: N/A
David Penn
Technical Writer for Technical Analysis of STOCKS & COMMODITIES magazine, Working-Money.com, and Traders.com Advantage.
PRINT THIS ARTICLE
DOW THEORY
Dow Theory Update
03/09/06 08:34:01 AMby David Penn
The Dow industrials and transports set spring goals in their late February retreat from year-to-date highs.
Position: N/A
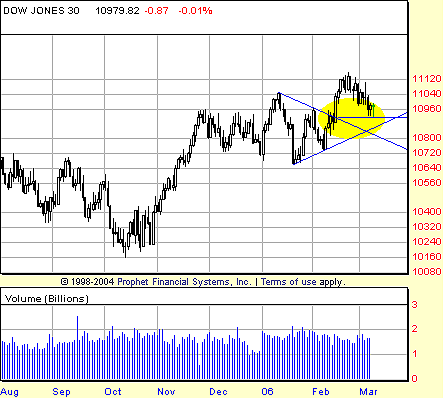
| Last month, I pointed to the breakout in the Dow industrials ("The Dow's Tempting Triangle," Traders.com Advantage, February 14, 2006) and the subsequent confirmation by the industrials of the new, year-to-date highs made by the Dow transports ("Confirming Industrials," Traders.com Advantage, February 17, 2006). This, as I suggested at the time, hinted strongly that the next major move in the markets would be higher as opposed to lower. See Figure 1. |
|
| FIGURE 1: DOW JONES INDUSTRIAL AVERAGE, DAILY. The Valentine's Day breakout in the Dow industrials pulls back to the breakout level in early March before reaching the minimum upside price projection suggested by the symmetrical triangle. |
| Graphic provided by: Prophet Financial, Inc. |
| |
| This buy signal has no doubt been the source of consternation for some insofar as the market's behavior goes, since that Dow theory buy signal has been less than overwhelmingly bullish. In fact, since that signal in mid-February a number of key sectors, including semiconductors, have begun not to rally but roll over. Breakouts in indexes like the banking index ($BKX) have failed, with prices sinking back into their consolidation ranges. |
| As I have written before about Dow theory buy signals (and sell signals, for that matter), they are often not the sorts of signals that can be treated as explicit, immediate commands. Often, these signals appear more geared toward preparing traders for what is about to happen -- generally after a period of countertrend (or "countersignal") behavior. Traders and speculators, thus, can be better off when such signals develop by waiting for the pullback that tends to follow (or bounce, in the case of a sell signal) and establishing a position at a likely better level. |
|
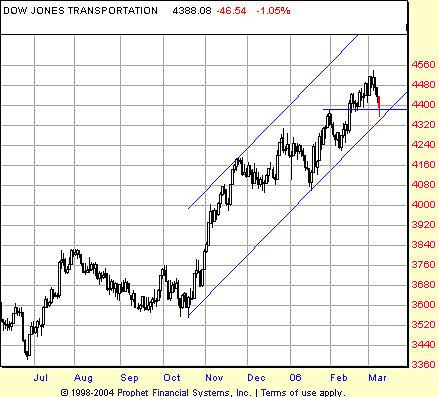
| FIGURE 2: DOW JONES TRANSPORTATION AVERAGE, DAILY. In spite of a growing bearishness in investor sentiment in the early spring of 2006, the Dow transports have continued to advance. The mid-February breakout here, unlike the one in the industrials, is still holding on a closing basis. This is also true of the trend channel that extends from the October 2005 lows. |
| Graphic provided by: Prophet Financial, Inc. |
| |
| Much of this is borne out simply by looking at charts of the Dow industrials and transports (Figure 2). For all the "sturm und drang" of various failing sectors, both the industrials and the transports have remained above their 50-day exponential moving averages (EMAs), with the transports only recently slipping below their 10-day EMAs on a closing basis. While this situation could change overnight, traders and speculators are now confronted with a market in which many stocks are under selling pressure while the larger-cap averages remain in uptrends. Some have highlighted this situation as a negative divergence. But it is worth remembering that there are two ways of resolving a negative divergence of this sort. The first, presumed by many to be in the "negative divergence" camp, is that the bigger-cap averages are buoyed by a "flight to safety" and the transports by lower crude oil prices, but that the gravitational pull of the "average stock" will eventually drag these averages -- the industrials and transports -- down into The Hole. |
| But there is a second take on this negative divergence, a take that considers the possibility of a more bullish resolution sooner as opposed to later. This take wonders that if stocks continue to fall and the averages remain flat, what happens when the stocks stop falling? Unless we are convinced that the market has established some enduring top in mid-February, then the likelihood is that the correction in many key stocks and sectors will come to an end without too many previous lows being taken out in the process (note the semiconductor index, as of this writing, still has not taken out a previous correction low, in spite of the breakdowns in many semiconductor stocks). And if those corrections come to an end with the averages still intact, then those opportunities to the upside suggested by the Dow theory buy signal from mid-February likely will become all the more apparent. What sort of mileposts should traders and speculators keep an eye out for going forward? The February lows in both averages are the initial level of support (beyond the 50-day EMAs, as I have already mentioned). The February highs in both the industrials and transports set the level of resistance. |
Technical Writer for Technical Analysis of STOCKS & COMMODITIES magazine, Working-Money.com, and Traders.com Advantage.
| Title: | Technical Writer |
| Company: | Technical Analysis, Inc. |
| Address: | 4757 California Avenue SW |
| Seattle, WA 98116 | |
| Phone # for sales: | 206 938 0570 |
| Fax: | 206 938 1307 |
| Website: | www.Traders.com |
| E-mail address: | DPenn@traders.com |
Traders' Resource Links | |
| Charting the Stock Market: The Wyckoff Method -- Books | |
| Working-Money.com -- Online Trading Services | |
| Traders.com Advantage -- Online Trading Services | |
| Technical Analysis of Stocks & Commodities -- Publications and Newsletters | |
| Working Money, at Working-Money.com -- Publications and Newsletters | |
| Traders.com Advantage -- Publications and Newsletters | |
| Professional Traders Starter Kit -- Software | |
Click here for more information about our publications!
Comments
Date:�03/09/06Rank:�3Comment:�

Request Information From Our Sponsors
- StockCharts.com, Inc.
- Candle Patterns
- Candlestick Charting Explained
- Intermarket Technical Analysis
- John Murphy on Chart Analysis
- John Murphy's Chart Pattern Recognition
- John Murphy's Market Message
- MurphyExplainsMarketAnalysis-Intermarket Analysis
- MurphyExplainsMarketAnalysis-Visual Analysis
- StockCharts.com
- Technical Analysis of the Financial Markets
- The Visual Investor
- VectorVest, Inc.
- Executive Premier Workshop
- One-Day Options Course
- OptionsPro
- Retirement Income Workshop
- Sure-Fire Trading Systems (VectorVest, Inc.)
- Trading as a Business Workshop
- VectorVest 7 EOD
- VectorVest 7 RealTime/IntraDay
- VectorVest AutoTester
- VectorVest Educational Services
- VectorVest OnLine
- VectorVest Options Analyzer
- VectorVest ProGraphics v6.0
- VectorVest ProTrader 7
- VectorVest RealTime Derby Tool
- VectorVest Simulator
- VectorVest Variator
- VectorVest Watchdog