HOT TOPICS LIST
- MACD
- Fibonacci
- RSI
- Gann
- ADXR
- Stochastics
- Volume
- Triangles
- Futures
- Cycles
- Volatility
- ZIGZAG
- MESA
- Retracement
- Aroon
INDICATORS LIST
LIST OF TOPICS
PRINT THIS ARTICLE
by David Penn
Another year, another head & shoulders top sends gold stocks on a correction course.
Position: N/A
David Penn
Technical Writer for Technical Analysis of STOCKS & COMMODITIES magazine, Working-Money.com, and Traders.com Advantage.
PRINT THIS ARTICLE
HEAD & SHOULDERS
Newmont's Head & Shoulders Top Redux
03/08/06 08:16:30 AMby David Penn
Another year, another head & shoulders top sends gold stocks on a correction course.
Position: N/A
| A little over a year ago, I wrote about a looming head & shoulders top in shares of Newmont Mining Corp. ("Newmont's Head and Shoulders Top," Traders.com Advantage, January 8, 2005). This prospective topping pattern reached its top in November, after a run from the low 30s that began back in April. At the time that article was written, Newmont Mining (NEM) had just broken down below a neckline level of about $43 and was targeted to reach as low as $36 in a minimum move down (Figure 1). |

|
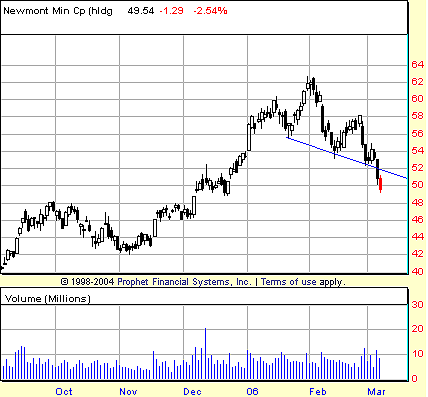
| FIGURE 1: NEWMONT MINING CORP., DAILY. A downwardly cast head & shoulders top appears to mark a correction in this widely traded gold mining stock. The slanted character of the pattern makes for a downside target that is surprisingly low in the form of $43. |
| Graphic provided by: Prophet Financial, Inc. |
| |
| That minimum move did not happen. After slipping to $40 in mid-January, NEM rallied strongly over the balance of the month, at one point reaching as high as $46.50 in late February. NEM did in fact hit $36 after this bear-crushing bounce. But those lows did not come until May and, even then, were relatively short-lived as the market for NEM shares rebounded from a mid-May low near $35 to reach $62 by January 2006. |
| And that is where this story, the story of Newmont's other head & shoulders top, begins. If there was a failing in the previous head & shoulders top, then that failing might have been in the fact that, as far as tops go, the 2005 head & shoulders top was no Mount McKinley. By that I mean there wasn't the sort of overextension to the upside that makes for excellent tops. At the time, NEM was barely trading over its 10-day exponential moving average (EMA), and fully a third of the pattern (namely, the right shoulder) was below the 50-day exponential moving average (EMA). More important, the former H&S top reached a peak of almost $50 after a run from the low 30s. The current H&S top reached a peak closer to $63, after an advance from similar lows. |

|
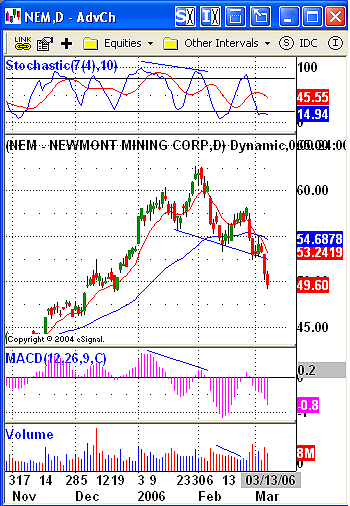
| FIGURE 2: NEWMONT MINING CORP., DAILY. Negative divergences in the stochastic and MACD histogram helped anticipate a downside resolution to this head & shoulders top. Note also the decline in volume during the formation of the right shoulder of the pattern — and the expansion in volume as prices move toward breakdown at the downwardly sloped neckline. |
| Graphic provided by: eSignal. |
| |
| There were a few valuable technical signals that traders and speculators could have used to help understand just where Newmont Mining was planning to take them. For me, foremost among these were the negative divergences in the stochastic and the moving average convergence/divergence (MACD) histogram (Figure 2). While I tend to prefer stochastic divergences when it comes to daily charts, the fact that the stochastic negative divergence is confirmed by the MACD histogram is a gratefully received bonus as far as I'm concerned. In addition, consider the depth of the MACD histogram in February. When such troughs develop in correcting markets, they often hint at further declines below those that correspond with the troughs. In other words, the deep MACD histogram as NEM fell to 53 in mid-February was a warning that that price level would likely be exceeded by a subsequent correction. |
| This is not always the case. Sometimes, deep MACD histogram troughs do not serve as harbingers of lower prices to come. These cases tend to involve markets that have not yet fallen below their 50-day EMAs, or have not created confirmed negative divergences in key indicators. Another sign for technicians to look for is whether the deep MACD histogram trough is followed by an equally (or comparably) high MACD histogram peak. Rather than warning of doom, that particular configuration of indicators often anticipates higher prices going forward rather than a significant correction. Compared to the breakdown in NEM from back in January 2005, the current breakdown is further along the corrective process. Actually, given a neckline (at its lower level) of about 53 and a formation that reaches 63 at its highest point, the current four- to five-point break puts NEM almost halfway to its projected minimum downside projection of about 42. |
Technical Writer for Technical Analysis of STOCKS & COMMODITIES magazine, Working-Money.com, and Traders.com Advantage.
| Title: | Technical Writer |
| Company: | Technical Analysis, Inc. |
| Address: | 4757 California Avenue SW |
| Seattle, WA 98116 | |
| Phone # for sales: | 206 938 0570 |
| Fax: | 206 938 1307 |
| Website: | www.Traders.com |
| E-mail address: | DPenn@traders.com |
Traders' Resource Links | |
| Charting the Stock Market: The Wyckoff Method -- Books | |
| Working-Money.com -- Online Trading Services | |
| Traders.com Advantage -- Online Trading Services | |
| Technical Analysis of Stocks & Commodities -- Publications and Newsletters | |
| Working Money, at Working-Money.com -- Publications and Newsletters | |
| Traders.com Advantage -- Publications and Newsletters | |
| Professional Traders Starter Kit -- Software | |
Click here for more information about our publications!
Comments
Date: 03/08/06Rank: 3Comment:

Request Information From Our Sponsors
- StockCharts.com, Inc.
- Candle Patterns
- Candlestick Charting Explained
- Intermarket Technical Analysis
- John Murphy on Chart Analysis
- John Murphy's Chart Pattern Recognition
- John Murphy's Market Message
- MurphyExplainsMarketAnalysis-Intermarket Analysis
- MurphyExplainsMarketAnalysis-Visual Analysis
- StockCharts.com
- Technical Analysis of the Financial Markets
- The Visual Investor
- VectorVest, Inc.
- Executive Premier Workshop
- One-Day Options Course
- OptionsPro
- Retirement Income Workshop
- Sure-Fire Trading Systems (VectorVest, Inc.)
- Trading as a Business Workshop
- VectorVest 7 EOD
- VectorVest 7 RealTime/IntraDay
- VectorVest AutoTester
- VectorVest Educational Services
- VectorVest OnLine
- VectorVest Options Analyzer
- VectorVest ProGraphics v6.0
- VectorVest ProTrader 7
- VectorVest RealTime Derby Tool
- VectorVest Simulator
- VectorVest Variator
- VectorVest Watchdog
