

HOT TOPICS LIST
- MACD
- Fibonacci
- RSI
- Gann
- ADXR
- Stochastics
- Volume
- Triangles
- Futures
- Cycles
- Volatility
- ZIGZAG
- MESA
- Retracement
- Aroon
INDICATORS LIST
LIST OF TOPICS
PRINT THIS ARTICLE
by Gary Grosschadl
The chart hinted at the surprise win on the last trading day before the Academy Awards.
Position: Hold
Gary Grosschadl
Independent Canadian equities trader and technical analyst based in Peterborough
Ontario, Canada.
PRINT THIS ARTICLE
CHANNEL LINES
CRASH As In The Movie, Not The Markets
03/07/06 02:10:54 PMby Gary Grosschadl
The chart hinted at the surprise win on the last trading day before the Academy Awards.
Position: Hold
| Lions Gate pulled off an upset win at the Academy Awards on Sunday, with the movie "Crash" winning Best Picture plus two more Oscars. Lions Gate, which is a Vancouver-based independent film production company, has had its stock price falling in a channel pattern the past nine months. On a longer-term chart, this stock had a tremendous run from $2.50 in 2003 to near $12 in 2005 before this nine-month correction. |
| This daily chart shows traders/speculators seeming to place their bets on the Friday before the awards ceremony (Figure 1). Note the gap up on higher than normal volume. This strong close has it breaking above the rising channel pattern. The following Monday, the stock opened with another gap and then traded down, with most of the day finishing at 9.60, 0.18 higher but off 0.31 from the high of 9.91. So was this just a speculative sell on open by those traders who pushed the price up on Friday, or was it the start of a new upleg? |
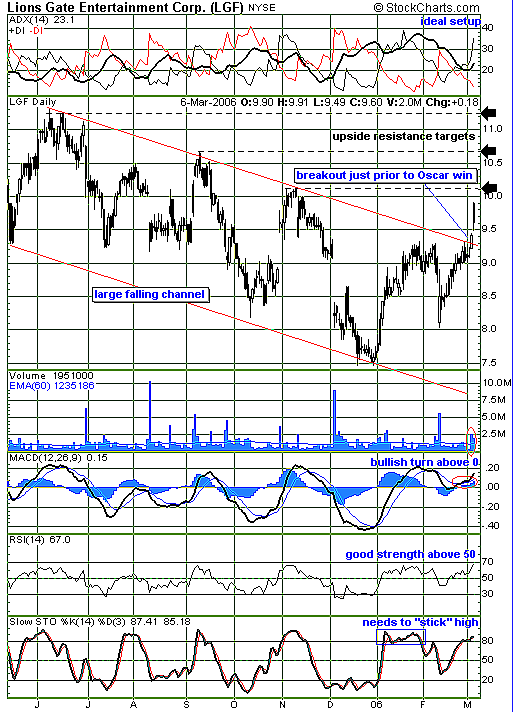
|
| FIGURE 1: LIONS GATE, DAILY. This chart shows the possibility of an upset Oscar win inspired traders. |
| Graphic provided by: StockCharts.com. |
| |
| Several indicators can give clues to what may transpire. At the top of the chart, the directional movement indicator shows an ideal setup with its three components bullishly poised. A rising average directional movement index (ADX) above 20, with the positive directional indicator +DI above its negative counterpart -DI, shows growing trend strength with bullish power in charge. The indicators below the chart are also bullishly poised. The moving average convergence/divergence (MACD) shows a bullish upturn and crossover above the zero line while the relative strength index (RSI) shows strength above the 50 level. The stochastics indicator shows an overbought condition, but this indicator can stick high when the uptrend is strong enough. A downturn below the 80 level normally signals a downleg beginning. |
| Should the warm glow of Oscar night continue to inspire the stock price, several upside trading targets are shown, all relating to previous resistance levels forming the top trendline. If, however, the stock slides back into the channel, all bets are off and a "crash" to the lower trendline cannot be ruled out. |
Independent Canadian equities trader and technical analyst based in Peterborough
Ontario, Canada.
| Website: | www.whatsonsale.ca/financial.html |
| E-mail address: | gwg7@sympatico.ca |
Click here for more information about our publications!
Comments
Date:�03/07/06Rank:�5Comment:�

Request Information From Our Sponsors
- StockCharts.com, Inc.
- Candle Patterns
- Candlestick Charting Explained
- Intermarket Technical Analysis
- John Murphy on Chart Analysis
- John Murphy's Chart Pattern Recognition
- John Murphy's Market Message
- MurphyExplainsMarketAnalysis-Intermarket Analysis
- MurphyExplainsMarketAnalysis-Visual Analysis
- StockCharts.com
- Technical Analysis of the Financial Markets
- The Visual Investor
- VectorVest, Inc.
- Executive Premier Workshop
- One-Day Options Course
- OptionsPro
- Retirement Income Workshop
- Sure-Fire Trading Systems (VectorVest, Inc.)
- Trading as a Business Workshop
- VectorVest 7 EOD
- VectorVest 7 RealTime/IntraDay
- VectorVest AutoTester
- VectorVest Educational Services
- VectorVest OnLine
- VectorVest Options Analyzer
- VectorVest ProGraphics v6.0
- VectorVest ProTrader 7
- VectorVest RealTime Derby Tool
- VectorVest Simulator
- VectorVest Variator
- VectorVest Watchdog