HOT TOPICS LIST
- MACD
- Fibonacci
- RSI
- Gann
- ADXR
- Stochastics
- Volume
- Triangles
- Futures
- Cycles
- Volatility
- ZIGZAG
- MESA
- Retracement
- Aroon
INDICATORS LIST
LIST OF TOPICS
PRINT THIS ARTICLE
by David Penn
After breaking out in mid-February and reaching its minimum upside price projection, the S&P 500 retraced nearly 50% of its gains. Now back at the breakout highs, the bulls find themselves bucking for more.
Position: N/A
David Penn
Technical Writer for Technical Analysis of STOCKS & COMMODITIES magazine, Working-Money.com, and Traders.com Advantage.
PRINT THIS ARTICLE
BREAKOUTS
From Breakout To Pullback
03/07/06 08:08:43 AMby David Penn
After breaking out in mid-February and reaching its minimum upside price projection, the S&P 500 retraced nearly 50% of its gains. Now back at the breakout highs, the bulls find themselves bucking for more.
Position: N/A
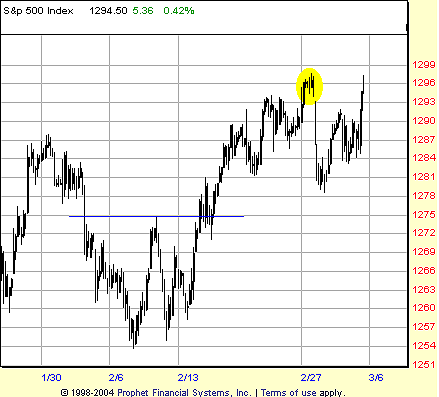
| Sometimes good money management will kick you out of good trades. A number of the systems I follow signaled buying opportunities in mid-February in the Dow Jones industrials, Standard & Poor's 500, and NASDAQ Composite. Looking at the $SPX daily chart in particular (Figure 1), these buying opportunities are all the more apparent as breakouts from bases that were built in the first few weeks of February. Unfortunately, as far as my positions were concerned, the options I'd purchased to take advantage of these imminent upside moves just didn't do as much as I needed them to by the time I needed them to do it. A scratch on the DIA trade and minor losses in the SPY and QQQQ ensued. |

|
| FIGURE 1: S&P 500, DAILY. Stan Weinstein's swing rule suggested an upside of some 20 points from the bottom formed in the first half of February. The S&P 500 advanced to the minimum upside target of 1296 but immediately retraced more than half of the breakout. |
| Graphic provided by: Prophet Financial, Inc. |
| |
| As the kids say, "That sucks." Those with sterner constitutions (or wider stops) have been able to enjoy the market's move higher over the course of the second half of February. That ride was not without some turbulence of its own, particularly during the last full week of February, which saw the market move higher, but in a manner so fitful that it could hardly be surprising that the market would take the opportunity of the final day of the month to stage its own little one-day minicrash. |
| What is interesting about this rally and correction in the second half of February is how well it responds to some of the basic technical analysis notions of breakouts, price patterns, and pullbacks. One axiom that underpins the technical thinking with regard to breakouts is that the consolidation or pattern that preceded them is often indicative of the breakout to come; a big consolidation or pattern is likely to lead to a big breakout. But more specifically, the size of the consolidation is often a clue to the magnitude of the breakout (or breakdown) when it occurs. This is the secret of minimum price projections in everything from rectangular, sideways consolidations to head & shoulders patterns, triangles, double tops and bottoms, and more. |

|
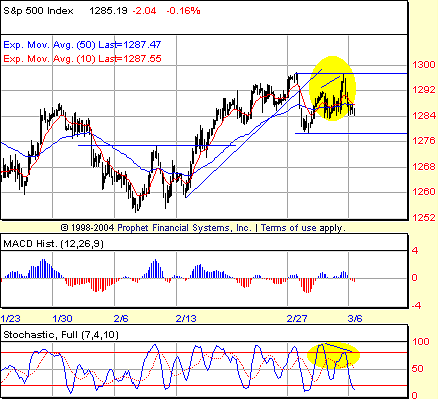
| FIGURE 2: S&P 500, DAILY. A break above 1297 or below 1278 will help resolve this 1-2-3 trend reversal attempt in the $SPX. Such a move would also provide a great deal of guidance to investors operating on longer time frames. |
| Graphic provided by: Prophet Financial, Inc. |
| |
| In this case, we can use Stan Weinstein's swing rule to compute the likely minimum upside from the late January/early February lows. With a formation size of about 20 points and a breakout level at approximately 1275, traders and speculators could expect a move to as high as the mid-1290s before any significant resistance to the advance could develop. Here, the $SPX followed the script to a T, breaking out on February 15 and moving with minimal correction to a closing hourly high of 1296.52 in the late afternoon of February 27. |
| That move was all that the breakout the early February consolidation seemed to have in it, for the market reversed fairly abruptly after those minimum upside targets were hit. In fact, the day after those highs were met, the $SPX collapsed sharply, falling nearly back to the breakout level before bouncing in an attempt to surpass the breakout high just north of 1296. As of this writing, this effort has failed and left the hourly $SPX with a possible 1-2-3 trend reversal setup with the 1297 and 1278 levels providing resistance and support, respectively (Figure 2). It is worth pointing out that the markets are due to establish seasonal spring lows anytime over the next few weeks. This, coupled with the sizable bearishness in the market (high put-call ratios, high bearish sentiment among small speculators, and so forth), suggests that the correction the $SPX might soon embark upon might be more of the buying variety than the shorting variety. |
Technical Writer for Technical Analysis of STOCKS & COMMODITIES magazine, Working-Money.com, and Traders.com Advantage.
| Title: | Technical Writer |
| Company: | Technical Analysis, Inc. |
| Address: | 4757 California Avenue SW |
| Seattle, WA 98116 | |
| Phone # for sales: | 206 938 0570 |
| Fax: | 206 938 1307 |
| Website: | www.Traders.com |
| E-mail address: | DPenn@traders.com |
Traders' Resource Links | |
| Charting the Stock Market: The Wyckoff Method -- Books | |
| Working-Money.com -- Online Trading Services | |
| Traders.com Advantage -- Online Trading Services | |
| Technical Analysis of Stocks & Commodities -- Publications and Newsletters | |
| Working Money, at Working-Money.com -- Publications and Newsletters | |
| Traders.com Advantage -- Publications and Newsletters | |
| Professional Traders Starter Kit -- Software | |
Click here for more information about our publications!
Comments
Date: 03/07/06Rank: 3Comment:
Date: 03/08/06Rank: 4Comment:

Request Information From Our Sponsors
- VectorVest, Inc.
- Executive Premier Workshop
- One-Day Options Course
- OptionsPro
- Retirement Income Workshop
- Sure-Fire Trading Systems (VectorVest, Inc.)
- Trading as a Business Workshop
- VectorVest 7 EOD
- VectorVest 7 RealTime/IntraDay
- VectorVest AutoTester
- VectorVest Educational Services
- VectorVest OnLine
- VectorVest Options Analyzer
- VectorVest ProGraphics v6.0
- VectorVest ProTrader 7
- VectorVest RealTime Derby Tool
- VectorVest Simulator
- VectorVest Variator
- VectorVest Watchdog
- StockCharts.com, Inc.
- Candle Patterns
- Candlestick Charting Explained
- Intermarket Technical Analysis
- John Murphy on Chart Analysis
- John Murphy's Chart Pattern Recognition
- John Murphy's Market Message
- MurphyExplainsMarketAnalysis-Intermarket Analysis
- MurphyExplainsMarketAnalysis-Visual Analysis
- StockCharts.com
- Technical Analysis of the Financial Markets
- The Visual Investor
