HOT TOPICS LIST
- MACD
- Fibonacci
- RSI
- Gann
- ADXR
- Stochastics
- Volume
- Triangles
- Futures
- Cycles
- Volatility
- ZIGZAG
- MESA
- Retracement
- Aroon
INDICATORS LIST
LIST OF TOPICS
PRINT THIS ARTICLE
by Paolo Pezzutti
A hammer candlestick formation associated with the oversold stochastic indicates that a short-term reversal could be on the horizon.
Position: N/A
Paolo Pezzutti
Author of the book "Trading the US Markets - A Comprehensive Guide to US Markets for International Traders and Investors" - Harriman House (July 2008)
PRINT THIS ARTICLE
CANDLESTICK CHARTING
McDonald's Tests For Short-Term Support
03/06/06 10:10:28 AMby Paolo Pezzutti
A hammer candlestick formation associated with the oversold stochastic indicates that a short-term reversal could be on the horizon.
Position: N/A
| Because of the industry's characteristics, you might expect a stable and low-volatility stock with McDonald's Corp. (MCD), but this is not always the case. Figure 1 shows the monthly chart. Prices reached the $49.56 level back in 1999. The low of March 2003 touched the $12.12 value. Similarly to most other stocks, since then, prices started an uptrend that brought prices to the present $35 level. |

|
| FIGURE 1: MCD, MONTHLY. A three-year uptrend brought prices up to the $35 level for McDonald's Corp. |
| Graphic provided by: TradeStation. |
| |
| In Figure 2, the weekly chart displays the fast correction that was initiated last March 2005 (point A). Prices moved following an a-b-c pattern to the July 2005 low, when bears remained trapped in a fast reaction to the upside. At point C, MCD started a long congestion very close to resistance. The breakout of that area brought prices to the new relative high of $36.75 printed last February. |

|
| FIGURE 2: MCD, WEEKLY. Prices are testing the moving average that sustained the last upleg. |
| Graphic provided by: TradeStation. |
| |
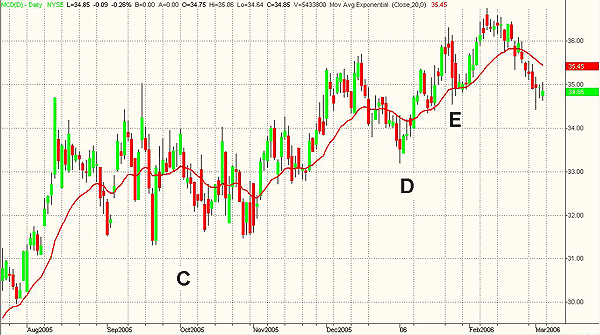
| At the daily level, in Figure 3, the point C area appears as a sideways movement characterized by high volatility and low directionality, with prices moving fast in a trading range between support and resistance levels. MCD remained in a market with no or little direction, with deep swings -- a favorable environment for countertrend traders. Note also that, finally, prices broke out of the trading range to the upside. Although the trend is defined, corrections are deep and volatile. There's public participation, but trend-followers risk being stopped out during reactions. This is a difficult marketplace for traders. At point D, MCD printed a fast a-b-c correction with a relative low on January 3. Bears once again remained trapped in the uptrend resumption. This stock is not easy to trade; in fact, note at point E how prices, after a long black candle indicating lower prices in the short term, went up a few days later and printed a new top. Was this the start of a new upleg? Not at all! It was a bull trap so traders could reenter the trading range on a deep correction. |

|
| FIGURE 3: MCD, DAILY. Normally, the stock prints volatile and deep corrections. |
| Graphic provided by: TradeStation. |
| |
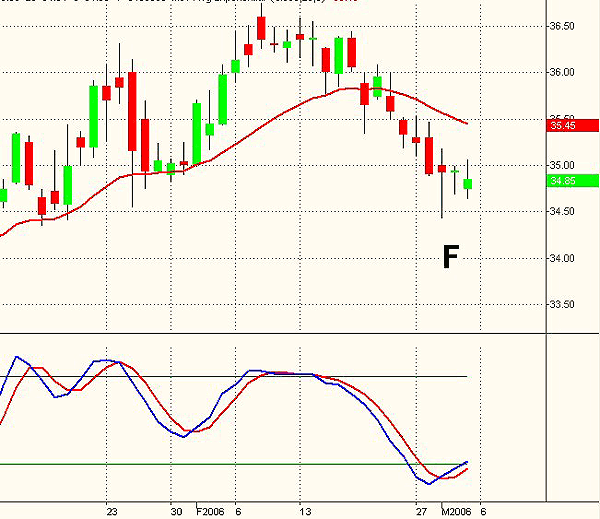
| In Figure 4, I focused on the last trading sessions. At point F, a hammer is printed on March 1. A hammer is a candlestick with a long lower shadow and a small real body. The real body is close to the top of the range. When it is printed during a downtrend, it signals that the move may end. The hammer can be recognized by the following characteristics: 1. The real body is at the upper end of the trading range. 2. The long lower shadow should be twice the height of the real body. 3. It should have no, or a very short, upper shadow. The hammer is more bullish if the real body is white. To print a hammer, the market must sell off sharply during the session and then bounce back to close near the bar's high. It is important that you wait for confirmations associating other indicators, such as oscillators, trendlines, and so forth. |

|
| FIGURE 4: MCD, DAILY. McDonald's printed a hammer at point F, associated to the stochastic oversold. |
| Graphic provided by: TradeStation. |
| |
| The day after the hammer, MCD printed another inside hammer. Finally, last Friday, March 3, another inside bar was printed. The market has not found the strength, so far, to continue lower. If you look at the slow stochastic, you will see that it is oversold, reinforcing the hammer indications of a possible impending short-term move to the upside. A typical short-term trade setup could be to enter a breakout of the hammer high, placing the stop-loss at the hammer low. Should you take this trade, controlling risk is very important, because these trades cannot all be successful. Volatility would increase should the pattern fail, with prices moving fast to the downside. |
Author of the book "Trading the US Markets - A Comprehensive Guide to US Markets for International Traders and Investors" - Harriman House (July 2008)
| Address: | VIA ROBERTO AGO 26 POSTAL CODE 00166 |
| Rome, ITALY | |
| Phone # for sales: | +393357540708 |
| E-mail address: | pezzutti.paolo@tiscali.it |
Click here for more information about our publications!
Comments
Date: 03/06/06Rank: 3Comment:

Request Information From Our Sponsors
- VectorVest, Inc.
- Executive Premier Workshop
- One-Day Options Course
- OptionsPro
- Retirement Income Workshop
- Sure-Fire Trading Systems (VectorVest, Inc.)
- Trading as a Business Workshop
- VectorVest 7 EOD
- VectorVest 7 RealTime/IntraDay
- VectorVest AutoTester
- VectorVest Educational Services
- VectorVest OnLine
- VectorVest Options Analyzer
- VectorVest ProGraphics v6.0
- VectorVest ProTrader 7
- VectorVest RealTime Derby Tool
- VectorVest Simulator
- VectorVest Variator
- VectorVest Watchdog
- StockCharts.com, Inc.
- Candle Patterns
- Candlestick Charting Explained
- Intermarket Technical Analysis
- John Murphy on Chart Analysis
- John Murphy's Chart Pattern Recognition
- John Murphy's Market Message
- MurphyExplainsMarketAnalysis-Intermarket Analysis
- MurphyExplainsMarketAnalysis-Visual Analysis
- StockCharts.com
- Technical Analysis of the Financial Markets
- The Visual Investor
