HOT TOPICS LIST
- MACD
- Fibonacci
- RSI
- Gann
- ADXR
- Stochastics
- Volume
- Triangles
- Futures
- Cycles
- Volatility
- ZIGZAG
- MESA
- Retracement
- Aroon
INDICATORS LIST
LIST OF TOPICS
PRINT THIS ARTICLE
by David Penn
A 1-2-3 trend reversal becomes a bear trap as positive divergences power the $SPX toward new, year-to-date highs.
Position: N/A
David Penn
Technical Writer for Technical Analysis of STOCKS & COMMODITIES magazine, Working-Money.com, and Traders.com Advantage.
PRINT THIS ARTICLE
TECHNICAL ANALYSIS
Fakeouts And Breakouts
03/03/06 11:44:58 AMby David Penn
A 1-2-3 trend reversal becomes a bear trap as positive divergences power the $SPX toward new, year-to-date highs.
Position: N/A
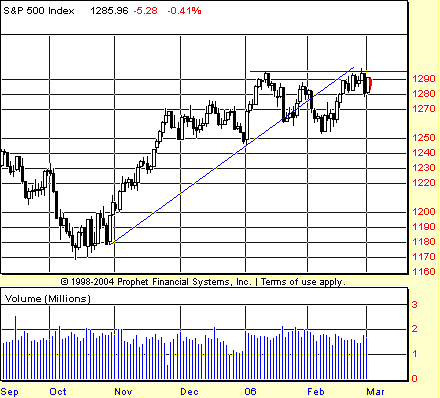
| "I do not know which to prefer, The beauty of inflections Or the beauty of innuendoes, The blackbird whistling Or just after." —Wallace Stevens, "Thirteen Ways of Looking at a Blackbird" Something akin to the gentle bewilderment suggested by the bard above visited me as I looked at a chart of the Standard & Poor's 500 since its bottom in October 2005 (Figure 1). Do we have a market that, since peaking early in January 2006, has attempted (and is still attempting) a bearish 1-2-3 trend reversal to the downside? Or do we have a market that is fitfully launching itself higher after breaking free from a bullish flag or wedge pattern, not unlike the giant bullish wedge of the first half of 2004? Or, given the market's more recent developments, do we have a failure to establish a new closing high come late February, a failure that suggests that the market is vulnerable to reversal? |

|
| FIGURE 1: S&P 500, DAILY. A 1-2-3 trend reversal appeared with the violation of the October–January trendline in mid-January and the attempt to set a new high at the end of January. However, prices reversed to the upside shortly after moving back below the initial low from the trend break. |
| Graphic provided by: Prophet Financial, Inc. |
| |
| Let's take a look at all three of the different ways of looking at the blackbird that is the S&P 500. The 1-2-3 Trend Reversal: The most constructive trendline for the rally that began in October 2005 is the one shown in Figure 1. It extends not from the absolute lows of October, but from the relatively higher lows at the end of the month. As I wrote recently for Traders.com Advantage ("Trendlines, Light Volume, And Live Cattle," March 1, 2006), it is important that the trendline be as close a facsimile of the actual trend as possible. Try drawing a trendline from the absolute lows of October 2005 and see where you end up. The market broke down below the trendline in mid-January. It wasn't by much — but the breakdown was completed on a closing basis. That established point 1 of the 1-2-3 trend reversal, a point beyond which a trader could feel reasonably sure about betting against the market. The S&P 500 then rallied in an effort to reestablish the uptrend in the second half of January. This effort failed, but did set point 2 of the 1-2-3 trend reversal. This point 2 is the upper boundary of the reversal, a move beyond which would suggest strongly that the market was not ready to reverse and, instead, was likely to move higher. Point 3, the break below the lows established by point 1, came just before the midpoint of February as the S&P 500 took out the point 1 lows on a closing basis. Time to go short, right? |
| Er, maybe not. As Figure 1 shows, the move to point 3 appears to have been a fakeout, a bear trap. The lows of the point 3 session turned out to be the lows of the correction that began in early January as the market reversed and began heading swiftly toward point 2 — and a possibly bullish resolution to this threat of a trend reversal. The $SPX closed above point 2 in mid-February, which signaled that the reversal was probably not going to occur and that the market was likely headed higher. But the $SPX thus far has failed to make a new high on a closing basis. While this situation could be resolved in a single session, traders should be prepared for a false move to the upside in the same way that the market faked to the downside back in early February. The fact that seasonal lows are expected over the next few weeks should further serve as a caution for those perhaps too eager to get in on the long side of a market that has not necessarily made up its mind about direction. |

|
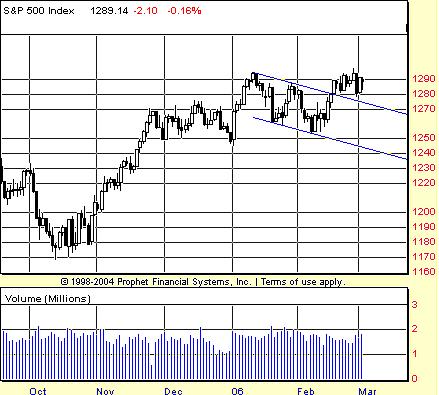
| FIGURE 2: S&P 500, DAILY. An A-B-C correction shortly after the beginning of the year appears to produce a breakout in mid-February. The upper boundary of the correction range that once served as resistance now provides support for the young breakout. |
| Graphic provided by: Prophet Financial, Inc. |
| |
| The Flag, The Wedge, The Whatever: If the 1-2-3 trend reversal ultimately leaves traders and speculators confused as to whether the market can move appreciable higher, then have I got an analysis for you! How about considering that the price action in January and February in the S&P 500 was essentially a flag ... or a wedge ... or, well, whatever you want to call a downwardly cast, A-B-C, "flat" (in Elliott wave parlance) type correction? I'm not going to get too hung up on classifying this formation, except to say that it reminds me of the market in 2004 (though that market featured three distinct lower lows, and the S&P 500 shown in Figure 2 has only two). In any event, it is easy to draw a trendline connecting the tops in early and late January, and then to create a parallel line connecting the lows of mid-January and early to mid-February. Once drawn, that formation clearly appears to have been breached by price action in mid-February. Not only that, but having broken out from our mystery formation, the $SPX has also confirmed the upper boundary (which formerly represented resistance) as a source of support — specifically with the 15-odd point decline and test on the last day of February. |

|
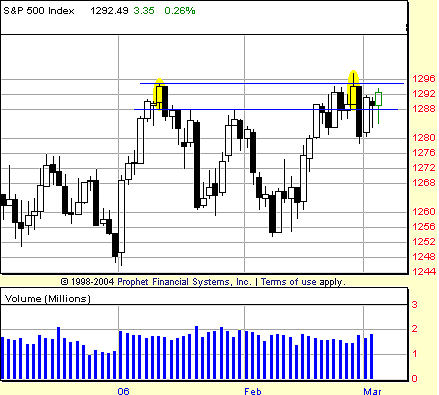
| FIGURE 3: S&P 500, DAILY. A 2B/Turtle Soup type top formed between the price peaks in January and late February. The sharp decline after the second, higher of the two peaks would have been sufficient in terms of downside follow-through — note how the decline takes out the low of the initial, lower peak in January — to trigger a short trade by the close of that session. |
| Graphic provided by: Prophet Financial, Inc. |
| |
| This is among the more bullish interpretations of the markets. Although the $SPX has failed to make a new closing higher for the year, it did set a new high on an intraday basis. And ironically enough, this intraday high itself has created yet another bearish interpretation of recent market action: 2B/Turtle Soup: As Figure 3 shows, the failure to show any follow-through to the upside in the wake of that new, year-to-date, intraday high set up a 2B/Turtle Soup type top, which gives the bears hope that there might be another chance to sell the market short. This 2B/Turtle Soup top is between the highs of January 11 and February 27 and would have been confirmed by the sharp decline on February 28. Recall that the entry target for the 2B/Turtle Soup top is just below the low of the earlier of the two tops. The January 11th low was 1288.12, a level that was more than compromised by the nearly 14-point decline on February 28. Depending on the way a speculator who took this short trade makes his or her exits, as of this writing such a position would still be in the "minor gain/minor loss" zone — leaving us with precious few clues as to the market's intended direction. |
Technical Writer for Technical Analysis of STOCKS & COMMODITIES magazine, Working-Money.com, and Traders.com Advantage.
| Title: | Technical Writer |
| Company: | Technical Analysis, Inc. |
| Address: | 4757 California Avenue SW |
| Seattle, WA 98116 | |
| Phone # for sales: | 206 938 0570 |
| Fax: | 206 938 1307 |
| Website: | www.Traders.com |
| E-mail address: | DPenn@traders.com |
Traders' Resource Links | |
| Charting the Stock Market: The Wyckoff Method -- Books | |
| Working-Money.com -- Online Trading Services | |
| Traders.com Advantage -- Online Trading Services | |
| Technical Analysis of Stocks & Commodities -- Publications and Newsletters | |
| Working Money, at Working-Money.com -- Publications and Newsletters | |
| Traders.com Advantage -- Publications and Newsletters | |
| Professional Traders Starter Kit -- Software | |
Click here for more information about our publications!
Comments
Date: 03/03/06Rank: 3Comment:
Date: 03/08/06Rank: 5Comment:

Request Information From Our Sponsors
- VectorVest, Inc.
- Executive Premier Workshop
- One-Day Options Course
- OptionsPro
- Retirement Income Workshop
- Sure-Fire Trading Systems (VectorVest, Inc.)
- Trading as a Business Workshop
- VectorVest 7 EOD
- VectorVest 7 RealTime/IntraDay
- VectorVest AutoTester
- VectorVest Educational Services
- VectorVest OnLine
- VectorVest Options Analyzer
- VectorVest ProGraphics v6.0
- VectorVest ProTrader 7
- VectorVest RealTime Derby Tool
- VectorVest Simulator
- VectorVest Variator
- VectorVest Watchdog
- StockCharts.com, Inc.
- Candle Patterns
- Candlestick Charting Explained
- Intermarket Technical Analysis
- John Murphy on Chart Analysis
- John Murphy's Chart Pattern Recognition
- John Murphy's Market Message
- MurphyExplainsMarketAnalysis-Intermarket Analysis
- MurphyExplainsMarketAnalysis-Visual Analysis
- StockCharts.com
- Technical Analysis of the Financial Markets
- The Visual Investor
