HOT TOPICS LIST
- MACD
- Fibonacci
- RSI
- Gann
- ADXR
- Stochastics
- Volume
- Triangles
- Futures
- Cycles
- Volatility
- ZIGZAG
- MESA
- Retracement
- Aroon
INDICATORS LIST
LIST OF TOPICS
PRINT THIS ARTICLE
by David Penn
As lumber futures plummet toward a 61.8% retracement of their August–December rally, would-be buyers find themselves looking for a bounce.
Position: N/A
David Penn
Technical Writer for Technical Analysis of STOCKS & COMMODITIES magazine, Working-Money.com, and Traders.com Advantage.
PRINT THIS ARTICLE
FIBONACCI
Bears Lay Wood To Lumber
03/02/06 01:32:04 PMby David Penn
As lumber futures plummet toward a 61.8% retracement of their August–December rally, would-be buyers find themselves looking for a bounce.
Position: N/A
| I don't pay an incredible amount of attention to the lumber market (my last look in Traders.com Advantage was in November 2004, "Will Lumber Get A Lift?"). In part, this is because I still don't understand exactly how lumber fits into a larger picture of economic activity (I think I know "where," but the "how," from an intermarket perspective, is a bit elusive). And, of course, in part this is because lumber is not among the most widely traded commodity in the pits. |

|
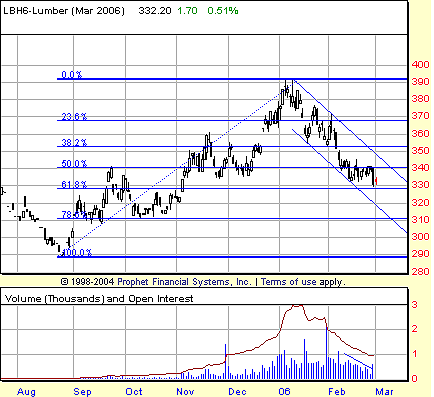
| FIGURE 1: MARCH LUMBER FUTURES, DAILY. The beginning of 2006 sees a top in the lumber rally that began in late August. Note how the decline, which is approaching possible support at the 61.8% Fibonacci retracement level, has been contained within a 30-point wide trend channel. |
| Graphic provided by: Prophet Financial, Inc. |
| |
| Speaking of "the pits," lumber futures have been in a true bear market since the beginning of the year (Figure 1). After rallying from $290 in late August to almost $390 by earliest January (a move of approximately $11,000 per contract, by the way), lumber (basis March) has given back more than half of those gains in the two months since. At present, March lumber is testing the 61.8% Fibonacci retracement level near $330 after slipping from a two-week consolidation range that developed over the second half of February. |
| Note how during that consolidation range in late February, volume contracted fairly sharply — leading, in fact, to the relatively higher volume day on February 28 that coincided with the market's apparent break from the range. This break comes at an interesting time for March lumber, which has had the entirety of its January–February decline enclosed by a trend channel. Follow-through to the downside from this break would almost certainly mean a test and possible penetration of the lower boundary of the trend channel. |

|
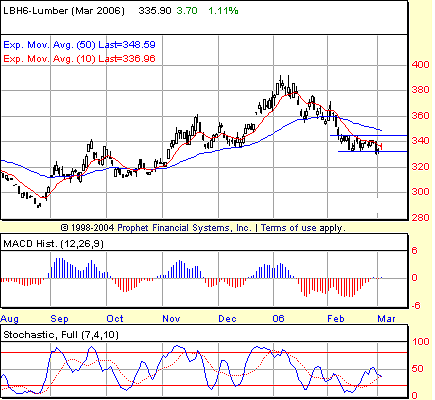
| FIGURE 2: MARCH LUMBER FUTURES, DAILY. The depth and size of the MACD histogram from mid-January to late February during lumber's decline suggests that lower prices will come before higher ones. A likely source of support in that instance would be between $310 and $320, where support exists from the lows of September and October. |
| Graphic provided by: Prophet Financial, Inc. |
| |
| In such a scenario, a further correction to the $310–320 level should not surprise traders. There is abundant support here, courtesy of the price lows of March lumber from back in October and September. Using the width of the February sideways consolidation as a measure of the possible initial break, the 13-point range of that consolidation at its widest point subtracted from the value at the bottom of the consolidation gives us an initial move to the 319.20 level. Should the lumber market fall to these levels (and it will soon be worth turning away from the March contract and toward the May contract), then it will have entered that $310–320 range of support (Figure 2). |
| Can we game the likelihood that lumber will indeed make this break before moving meaningfully higher? The increase in volume on the breakdown session on February 28 as one strong indication of a market that is looking lower. Another is the size of the moving average convergence/divergence (MACD) histogram that has been formed over the course of lumber's decline. The fact that none of the minor bounces in March lumber have managed to create a comparably sized MACD histogram to the upside (a classic MACDH signature of a bottom) is another vote in favor of lower sooner, with the possibility of higher later. |
Technical Writer for Technical Analysis of STOCKS & COMMODITIES magazine, Working-Money.com, and Traders.com Advantage.
| Title: | Technical Writer |
| Company: | Technical Analysis, Inc. |
| Address: | 4757 California Avenue SW |
| Seattle, WA 98116 | |
| Phone # for sales: | 206 938 0570 |
| Fax: | 206 938 1307 |
| Website: | www.Traders.com |
| E-mail address: | DPenn@traders.com |
Traders' Resource Links | |
| Charting the Stock Market: The Wyckoff Method -- Books | |
| Working-Money.com -- Online Trading Services | |
| Traders.com Advantage -- Online Trading Services | |
| Technical Analysis of Stocks & Commodities -- Publications and Newsletters | |
| Working Money, at Working-Money.com -- Publications and Newsletters | |
| Traders.com Advantage -- Publications and Newsletters | |
| Professional Traders Starter Kit -- Software | |
Click here for more information about our publications!
Comments
Date: 03/03/06Rank: 2Comment:

Request Information From Our Sponsors
- StockCharts.com, Inc.
- Candle Patterns
- Candlestick Charting Explained
- Intermarket Technical Analysis
- John Murphy on Chart Analysis
- John Murphy's Chart Pattern Recognition
- John Murphy's Market Message
- MurphyExplainsMarketAnalysis-Intermarket Analysis
- MurphyExplainsMarketAnalysis-Visual Analysis
- StockCharts.com
- Technical Analysis of the Financial Markets
- The Visual Investor
- VectorVest, Inc.
- Executive Premier Workshop
- One-Day Options Course
- OptionsPro
- Retirement Income Workshop
- Sure-Fire Trading Systems (VectorVest, Inc.)
- Trading as a Business Workshop
- VectorVest 7 EOD
- VectorVest 7 RealTime/IntraDay
- VectorVest AutoTester
- VectorVest Educational Services
- VectorVest OnLine
- VectorVest Options Analyzer
- VectorVest ProGraphics v6.0
- VectorVest ProTrader 7
- VectorVest RealTime Derby Tool
- VectorVest Simulator
- VectorVest Variator
- VectorVest Watchdog
