

HOT TOPICS LIST
- MACD
- Fibonacci
- RSI
- Gann
- ADXR
- Stochastics
- Volume
- Triangles
- Futures
- Cycles
- Volatility
- ZIGZAG
- MESA
- Retracement
- Aroon
INDICATORS LIST
LIST OF TOPICS
PRINT THIS ARTICLE
by David Penn
A trendline break and a bounce on light volume spell reversal for February cattle futures.
Position: N/A
David Penn
Technical Writer for Technical Analysis of STOCKS & COMMODITIES magazine, Working-Money.com, and Traders.com Advantage.
PRINT THIS ARTICLE
TECHNICAL ANALYSIS
Trendlines, Light Volume, And Live Cattle
03/01/06 01:20:48 PMby David Penn
A trendline break and a bounce on light volume spell reversal for February cattle futures.
Position: N/A
I am in full agreement with Victor Sperandeo, author of Methods Of A Wall Street Master and Principles Of Professional Speculation, when he describes his method of casting trendlines. After noting "one of the biggest mistakes made by amateurs and professionals alike is inconsistently defining and drawing the trendline," Sperandeo provides a surefire way of building a better line that includes this important point:For an uptrend within the period of consideration, draw a line from the lowest low, up and to the highest minor low point preceding the highest high so that the line does not pass through prices in between the two low points. Extend the line upwards past the highest high point. It is possible that the line will go through prices past the highest minor high point. |
|
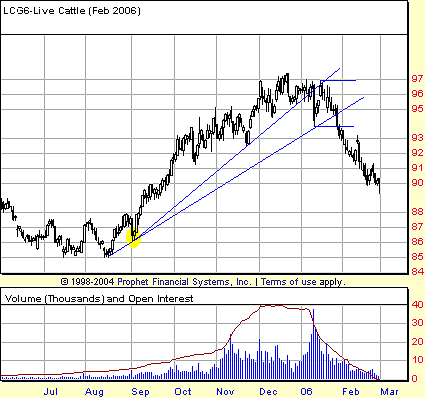
| FIGURE 1: FEBRUARY LIVE CATTLE, DAILY. The trendline beginning from the low marked by the yellow oval is a more accurate reflection of the trend than is the trendline that begins from the lows in mid-August. |
| Graphic provided by: Prophet Financial, Inc. |
| |
| As clear as this advice is, charts in the real world sometimes present a challenge to Sperandeo's trendline-casting orthodoxy. Figure 1 is a relatively mild example. Generally speaking, in drawing a trendline for the uptrend from the late summer to the mid-winter of 2005, Sperandeo might have us start with the lows of mid-August. After all, those lows do represent the "lowest low" in the "period of consideration." |
| The problem? A trendline drawn from the mid-August lows to the "highest minor low point preceding the highest high" — shown as the lower of the two trendlines in Figure 1 — is an almost worthless trendline because it does a poor job of reflecting the trend in prices. Some technicians would work around this problem by cutting through some of the intraday price action at the end of August and the beginning of September (the area highlighted by the oval). While chartists can get away with this many times, sooner or later it is bound to catch up with them. After all, if a technician can pick and choose what prices are important and which ones are just noise, then how is he or she supposed to create what Sperandeo says needs to be "extremely consistent and very accurate"? Are intraday price extremes always to be ignored? Or only when they are inconvenient? |
|
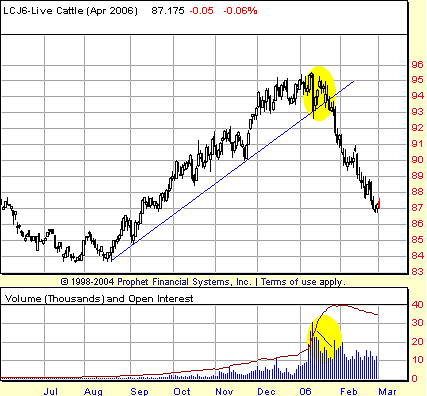
| FIGURE 2: APRIL LIVE CATTLE FUTURES, DAILY. A major decline on overwhelming volume takes April live cattle to a test of its uptrend line. Declining volume in the days following suggested that the bounce would not be sustained. Days later, the market for April live cattle slipped below its 4.5-month uptrend line on a closing basis. |
| Graphic provided by: Prophet Financial, Inc. |
| |
| The easiest way around this situation is simply to move the "lowest low" forward, essentially changing your "period of consideration" to exclude the lows that make drawing an "extremely consistent and very accurate" trendline almost impossible. This is a far more honest way of dealing with the problem of price extremes "getting in the way" of an otherwise perfectly cast trendline. In Figure 1, rather than ram a trendline through the price extremes at the end of August and beginning of September, why not start the trendline at those price extremes and see if in fact a more accurate reflection of the trend can be created that way? Interestingly, looking at the chart for April live cattle futures shown in Figure 2, we see that we can draw a proper trendline from the mid-August lows. |
| I want also to draw attention to the chart of April futures because I think they provide a better reflection of the volume action as prices approached the trendline in January 2006. I say this because by late January, the volume in the February contract naturally begins to taper off dramatically as traders roll out of February and into the April contract (note: as of March 2006, the Chicago Mercantile Exchange [CME] is offering a March contract for live cattle, according the Merc's website, but I wasn't able to chart that contract with Prophet.net or eSignal, so I'm going to stick with the more familiar and — apparently — still more widely traded April contract). So looking to the chart of April futures, we can see the huge volume on the major selling session on January 11. It is on this session that the market pulls back to the trendline, testing it for support. The bounce that follows not only fails to make a new high (one key test in and of itself), but the volume that accompanies the seven-day effort on the part of the bulls to move the market higher grows steadily weaker. In fact, even the session that sees the market close below the trendline occurs on light volume. It takes another three days before another huge volume day sends the market through support at 93 cents (support from the lows of January 11), allowing the decline to begin in earnest. |
Technical Writer for Technical Analysis of STOCKS & COMMODITIES magazine, Working-Money.com, and Traders.com Advantage.
| Title: | Technical Writer |
| Company: | Technical Analysis, Inc. |
| Address: | 4757 California Avenue SW |
| Seattle, WA 98116 | |
| Phone # for sales: | 206 938 0570 |
| Fax: | 206 938 1307 |
| Website: | www.Traders.com |
| E-mail address: | DPenn@traders.com |
Traders' Resource Links | |
| Charting the Stock Market: The Wyckoff Method -- Books | |
| Working-Money.com -- Online Trading Services | |
| Traders.com Advantage -- Online Trading Services | |
| Technical Analysis of Stocks & Commodities -- Publications and Newsletters | |
| Working Money, at Working-Money.com -- Publications and Newsletters | |
| Traders.com Advantage -- Publications and Newsletters | |
| Professional Traders Starter Kit -- Software | |
Click here for more information about our publications!
Comments
Date:�03/01/06Rank:�3Comment:�
Date:�03/08/06Rank:�4Comment:�

Request Information From Our Sponsors
- StockCharts.com, Inc.
- Candle Patterns
- Candlestick Charting Explained
- Intermarket Technical Analysis
- John Murphy on Chart Analysis
- John Murphy's Chart Pattern Recognition
- John Murphy's Market Message
- MurphyExplainsMarketAnalysis-Intermarket Analysis
- MurphyExplainsMarketAnalysis-Visual Analysis
- StockCharts.com
- Technical Analysis of the Financial Markets
- The Visual Investor
- VectorVest, Inc.
- Executive Premier Workshop
- One-Day Options Course
- OptionsPro
- Retirement Income Workshop
- Sure-Fire Trading Systems (VectorVest, Inc.)
- Trading as a Business Workshop
- VectorVest 7 EOD
- VectorVest 7 RealTime/IntraDay
- VectorVest AutoTester
- VectorVest Educational Services
- VectorVest OnLine
- VectorVest Options Analyzer
- VectorVest ProGraphics v6.0
- VectorVest ProTrader 7
- VectorVest RealTime Derby Tool
- VectorVest Simulator
- VectorVest Variator
- VectorVest Watchdog