HOT TOPICS LIST
- MACD
- Fibonacci
- RSI
- Gann
- ADXR
- Stochastics
- Volume
- Triangles
- Futures
- Cycles
- Volatility
- ZIGZAG
- MESA
- Retracement
- Aroon
INDICATORS LIST
LIST OF TOPICS
PRINT THIS ARTICLE
by Gary Grosschadl
The world's second-largest nickel producer, Inco Ltd., has started a downleg. How far can it go?
Position: Sell
Gary Grosschadl
Independent Canadian equities trader and technical analyst based in Peterborough
Ontario, Canada.
PRINT THIS ARTICLE
DOUBLE TOPS
Canadian Nickel Giant Inco May Have Topped Out
03/01/06 07:44:59 AMby Gary Grosschadl
The world's second-largest nickel producer, Inco Ltd., has started a downleg. How far can it go?
Position: Sell
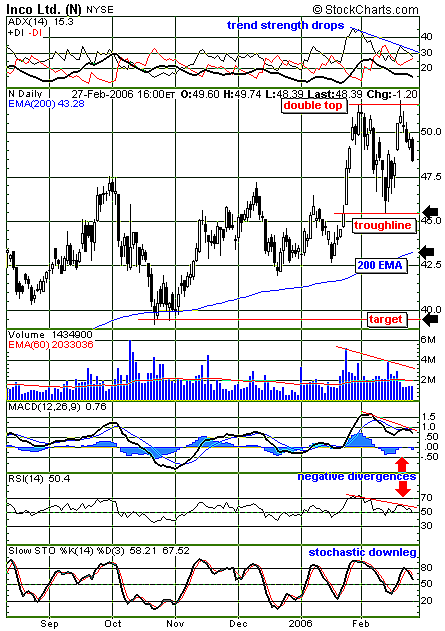
| The daily chart shown in Figure 1 suggests a double top may be in the works for Inco (N). Technically, a double top is not declared until the trough line is broken, at $45.50. So for the time being it's a possible double top. |
| Should the trough line break to the downside, two possible targets come into play: the ever-important 200-day exponential moving average (EMA) currently at $43.28 and the pattern fulfillment target at roughly $39.50. This measured move is equal to the distance between the top of the double top and the trough line, as applied below the trough line. |

|
| FIGURE 1: INCO, DAILY. This chart hints at a possible double top for N. |
| Graphic provided by: StockCharts.com. |
| |
| Several indicators lend credence to the double-top theory. These all have negative divergences to the price action of the double top, showing less conviction at the second peak. At the top of the chart, the average directional movement index (ADX) and +DI components (the positive directional indicator) show a drop in bullish conviction and trend strength. Likewise, the moving average convergence/divergence (MACD) also shows a drop in trend strength at the second peak. The relative strength index (RSI) and the stochastic oscillator also have declining peaks. They all hinted at a coming downleg as a result of waning conviction by the bulls. |
| The first real test comes at the trough line. A bounce here negates the double-top formation, whereas failure shows the pattern to be valid. In the latter case, whether the pattern actually goes to the below $40 target, only time will tell. |
Independent Canadian equities trader and technical analyst based in Peterborough
Ontario, Canada.
| Website: | www.whatsonsale.ca/financial.html |
| E-mail address: | gwg7@sympatico.ca |
Click here for more information about our publications!
Comments
Date: 03/01/06Rank: 5Comment:

Request Information From Our Sponsors
- StockCharts.com, Inc.
- Candle Patterns
- Candlestick Charting Explained
- Intermarket Technical Analysis
- John Murphy on Chart Analysis
- John Murphy's Chart Pattern Recognition
- John Murphy's Market Message
- MurphyExplainsMarketAnalysis-Intermarket Analysis
- MurphyExplainsMarketAnalysis-Visual Analysis
- StockCharts.com
- Technical Analysis of the Financial Markets
- The Visual Investor
- VectorVest, Inc.
- Executive Premier Workshop
- One-Day Options Course
- OptionsPro
- Retirement Income Workshop
- Sure-Fire Trading Systems (VectorVest, Inc.)
- Trading as a Business Workshop
- VectorVest 7 EOD
- VectorVest 7 RealTime/IntraDay
- VectorVest AutoTester
- VectorVest Educational Services
- VectorVest OnLine
- VectorVest Options Analyzer
- VectorVest ProGraphics v6.0
- VectorVest ProTrader 7
- VectorVest RealTime Derby Tool
- VectorVest Simulator
- VectorVest Variator
- VectorVest Watchdog
