

HOT TOPICS LIST
- MACD
- Fibonacci
- RSI
- Gann
- ADXR
- Stochastics
- Volume
- Triangles
- Futures
- Cycles
- Volatility
- ZIGZAG
- MESA
- Retracement
- Aroon
INDICATORS LIST
LIST OF TOPICS
PRINT THIS ARTICLE
by Gary Grosschadl
With headlines like "$150,000 of Hijacked Fish" and "The Great Cookie Caper," this company draws attention to its niche of vehicle recovery.
Position: Buy
Gary Grosschadl
Independent Canadian equities trader and technical analyst based in Peterborough
Ontario, Canada.
PRINT THIS ARTICLE
DESCENDING TRIANGLES
The Lowdown On LoJack
02/28/06 08:47:43 AMby Gary Grosschadl
With headlines like "$150,000 of Hijacked Fish" and "The Great Cookie Caper," this company draws attention to its niche of vehicle recovery.
Position: Buy
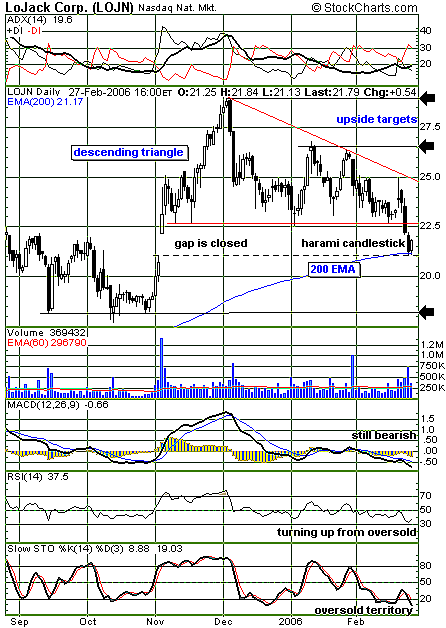
| Although this pattern looks like it's breaking down, a closer look hints at a possible buying opportunity for bold traders (Figure 1). The descending triangle, which is sometimes considered to have a bearish bias, shows a break lower on increased volume. This normally has long traders abandoning positions while shorters sharpen their knives. In this case, however, we can plead mitigating circumstances. |
| Three considerations are given here for a bear trap. The stock has come down to touch the 200-day exponential moving average (EMA). This important moving average often acts as strong support or resistance and can fuel a bounce at support. Second, a sizable former gap has been closed. Some stocks have a habit of coming back to close previous gaps before resuming their uptrend. This attracts buyers who like to assume lower risk positions of buying at potential support. The third enticement is the candlestick pattern called "harami." Stocks in a downtrend can show bears running out of gas with such a pattern where the current candlestick body is contained in the previous day's down candlestick. This suggests a loss in downside momentum, followed by a reversal or sideways action. With this confluence of support, a bounce is likely here. |
|
| FIGURE 1: LOJACK, DAILY. A confluence of support is suggested on this chart of LOJN despite a pattern failure. |
| Graphic provided by: StockCharts.com. |
| |
| Although most indicators are still bearish on the graphs below the chart, I should note that they are all in an oversold condition, which normally means a bounce is not far off. However, the relative strength indicator does show an early hint of an upturn developing as it bounces off an oversold 30 position. |
| Should a bounce ensue here and the triangle be broken topside, two upside targets are suggested. These targets of 26.50 and 29 relate to previous areas of resistance and would be short- to medium-term targets for aggressive traders. Should support not hold here at the 200-day EMA, then the downside target would be previous support near $18. |
Independent Canadian equities trader and technical analyst based in Peterborough
Ontario, Canada.
| Website: | www.whatsonsale.ca/financial.html |
| E-mail address: | gwg7@sympatico.ca |
Click here for more information about our publications!
Comments
Date:�02/28/06Rank:�5Comment:�
Date:�03/01/06Rank:�4Comment:�

Request Information From Our Sponsors
- StockCharts.com, Inc.
- Candle Patterns
- Candlestick Charting Explained
- Intermarket Technical Analysis
- John Murphy on Chart Analysis
- John Murphy's Chart Pattern Recognition
- John Murphy's Market Message
- MurphyExplainsMarketAnalysis-Intermarket Analysis
- MurphyExplainsMarketAnalysis-Visual Analysis
- StockCharts.com
- Technical Analysis of the Financial Markets
- The Visual Investor
- VectorVest, Inc.
- Executive Premier Workshop
- One-Day Options Course
- OptionsPro
- Retirement Income Workshop
- Sure-Fire Trading Systems (VectorVest, Inc.)
- Trading as a Business Workshop
- VectorVest 7 EOD
- VectorVest 7 RealTime/IntraDay
- VectorVest AutoTester
- VectorVest Educational Services
- VectorVest OnLine
- VectorVest Options Analyzer
- VectorVest ProGraphics v6.0
- VectorVest ProTrader 7
- VectorVest RealTime Derby Tool
- VectorVest Simulator
- VectorVest Variator
- VectorVest Watchdog