HOT TOPICS LIST
- MACD
- Fibonacci
- RSI
- Gann
- ADXR
- Stochastics
- Volume
- Triangles
- Futures
- Cycles
- Volatility
- ZIGZAG
- MESA
- Retracement
- Aroon
INDICATORS LIST
LIST OF TOPICS
PRINT THIS ARTICLE
by Gary Grosschadl
F5 Networks provides products and services to manage Internet traffic worldwide. And the stock price is moving higher.
Position: Buy
Gary Grosschadl
Independent Canadian equities trader and technical analyst based in Peterborough
Ontario, Canada.
PRINT THIS ARTICLE
ASCENDING TRIANGLES
F5 Networks Thrusts Higher
02/28/06 08:08:12 AMby Gary Grosschadl
F5 Networks provides products and services to manage Internet traffic worldwide. And the stock price is moving higher.
Position: Buy
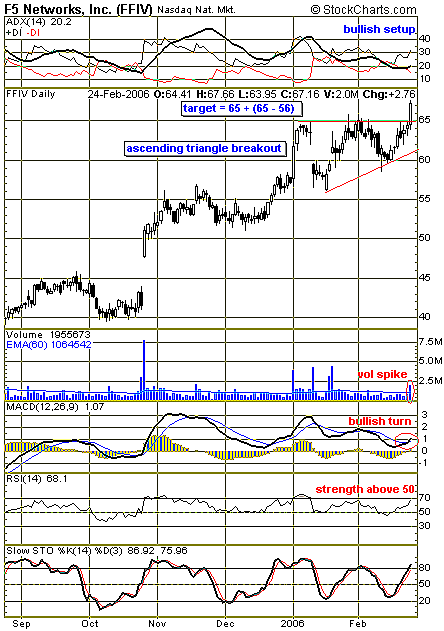
| Figure 1 shows a strong finish on the week with a bold move higher to break out from an ascending triangle. These triangles have a bullish bias, as the price pattern tightens to have the top trendline resistance eventually challenged. |
| The large gap move from last October foretold the bullish continuation. However, the stock did consolidate sideways for some time before breaking higher. No doubt some traders were wondering if the gap would close, giving latecomers another chance to enter at more favorable prices. This is an example of a gap refusing to close before another upleg developing. |

|
| FIGURE 1: F5 NETWORKS, DAILY. This chart of FFIV shows a breakout move past recent resistance. |
| Graphic provided by: StockCharts.com. |
| |
| The upside target for a triangle breakout is a measured move equal to the widest formation of the triangle, applied to the upside break past the top trendline. This results in a target of $74 (65 + 9). This does not mean it will be fulfilled; it only indicates that the potential exists. |
| Several indicators show bullish promise as well. The directional movement indicator at the top of the chart shows a bullish setup. With the positive directional indicator (+DI) above its negative power counterpart (-DI), the bulls are in charge. An upsloping average directional moving index (ADX) above 20 shows a strong trend in place (some traders prefer ADX above 25). This breakout move is confirmed by larger than normal volume, giving bulls added confidence. The moving average convergence/divergence (MACD) shows a strong trend via a bullish turn and crossover above the zero line. Likewise, the relative strength index (RSI) shows strength above its 50 level. The stochastics oscillator is just reaching an overbought level, but this indicator can "stick" high for extended intervals if the trend is strong enough. |
| Whether this stock continues higher without coming back to test the breakout point, only the market knows for sure. |
Independent Canadian equities trader and technical analyst based in Peterborough
Ontario, Canada.
| Website: | www.whatsonsale.ca/financial.html |
| E-mail address: | gwg7@sympatico.ca |
Click here for more information about our publications!
Comments
Date: 02/28/06Rank: 5Comment:
Date: 03/01/06Rank: 3Comment:

Request Information From Our Sponsors
- StockCharts.com, Inc.
- Candle Patterns
- Candlestick Charting Explained
- Intermarket Technical Analysis
- John Murphy on Chart Analysis
- John Murphy's Chart Pattern Recognition
- John Murphy's Market Message
- MurphyExplainsMarketAnalysis-Intermarket Analysis
- MurphyExplainsMarketAnalysis-Visual Analysis
- StockCharts.com
- Technical Analysis of the Financial Markets
- The Visual Investor
- VectorVest, Inc.
- Executive Premier Workshop
- One-Day Options Course
- OptionsPro
- Retirement Income Workshop
- Sure-Fire Trading Systems (VectorVest, Inc.)
- Trading as a Business Workshop
- VectorVest 7 EOD
- VectorVest 7 RealTime/IntraDay
- VectorVest AutoTester
- VectorVest Educational Services
- VectorVest OnLine
- VectorVest Options Analyzer
- VectorVest ProGraphics v6.0
- VectorVest ProTrader 7
- VectorVest RealTime Derby Tool
- VectorVest Simulator
- VectorVest Variator
- VectorVest Watchdog
