HOT TOPICS LIST
- MACD
- Fibonacci
- RSI
- Gann
- ADXR
- Stochastics
- Volume
- Triangles
- Futures
- Cycles
- Volatility
- ZIGZAG
- MESA
- Retracement
- Aroon
INDICATORS LIST
LIST OF TOPICS
PRINT THIS ARTICLE
by David Penn
Positive divergences in the MACD histogram and stochastic bring about a badly needed bounce in the greenback.
Position: N/A
David Penn
Technical Writer for Technical Analysis of STOCKS & COMMODITIES magazine, Working-Money.com, and Traders.com Advantage.
PRINT THIS ARTICLE
REVERSAL
Divergences Drive The Dollar Higher
02/28/06 08:45:24 AMby David Penn
Positive divergences in the MACD histogram and stochastic bring about a badly needed bounce in the greenback.
Position: N/A
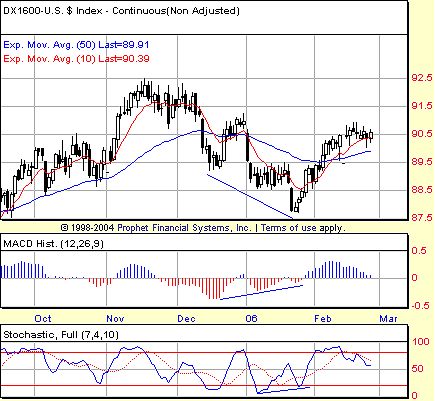
Back in December 2005, I wrote that the US dollar correction was likely to get worse if support could not be found in the immediate term ("Get Support Or Die Tryin'," Traders.com Advantage, December 16, 2005). At the time, DX (the continuous US dollar index futures) had fallen from a November high of 92.5 to 89.5 by mid-December. Specifically, I wrote that:For better or worse, it appears as if the greenback might have further to fall. One reason I suspect this is the fact that the moving average convergence/divergence (MACD) histogram is continuing to make new lows as price does. While not every decline needs to be concluded with a positive divergence, most significant bottoms do create such divergences. Note also that the stochastic is making lower lows along with price as well. The fact that neither indicator looks poised to create a positive divergence is, at a minimum, a warning that there may be more selling to come for the greenback. |

|
| FIGURE 1: DOLLAR INDEX, CONTINUOUS FUTURES, DAILY. Lower lows in price over the course of December and January are matched with higher lows in both the MACD histogram (December and January) and the stochastic (January). |
| Graphic provided by: Prophet Financial, Inc. |
| |
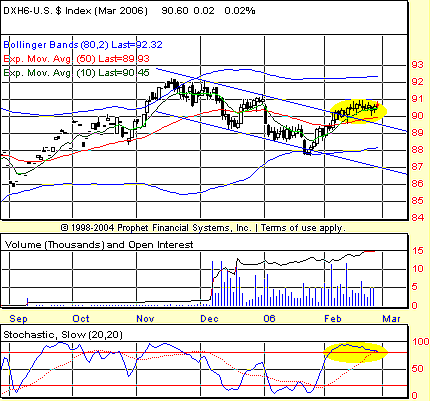
| Precisely as I was writing that article, the DX found support -- temporarily -- and bounced nearly three-quarters of a point to test the resistance provided by the low end of the November trading range. As I suspected in "Get Support Or Die Tryin'" and as Figure 2 shows clearly, that resistance proved too strong and the support the market gained near the $89.5 level gave way when the DX made a return visit in earliest January 2006. |
| But what the correction in the dollar did not have back in December 2005 became present in abundance by late January. I am referring to the sort of positive (or bullish) divergences that often signal significant turning points in the markets. The first sign of a positive divergence arrived in the form of higher lows in the moving average convergence/divergence (MACD) histogram from December to January. Generally, on a daily chart, my preference is for stochastic divergences rather than MACD histogram divergences, although it is often an excellent opportunity to have both. Here, the MACD histogram divergence came first. That divergence was followed by a still-lower low in price. While this meant that the initial positive divergence was "aborted" (to use Alexander Elder's phrase from his book Trading For A Living), it did set up both a shorter-term positive divergence in the MACD histogram as well as a same-month positive divergence in the stochastic. |

|
| FIGURE 2: DOLLAR INDEX, CONTINUOUS FUTURES, DAILY. The BOSO screen shows the stochastic breakout in the March dollar early in February. Note how the stochastic breakout occurs simultaneously with the market's breakout above the multimonth downtrend line. |
| Graphic provided by: Prophet Financial, Inc. |
| |
| Aborted early signals or no, the abundance of positive divergences signaled that the market was running out of energy to keep moving lower and that the odds of a bounce -- or even a reversal -- were increasing with every session. Figure 2 (the BOSO screen) shows how the correction low found support at the lower end of an 80-period Bollinger Band just before it began moving higher in earnest in the last few days of January. What is also interesting is that the March dollar experienced a "stochastic breakout" (that is, moved into overbought territory) at the same time that it broke out of the trend channel that had bound its price action since mid-November. |
| That the market has not slipped from its stochastic breakout (per Figure 2) and has created a sizable MACD histogram peak with its move above the 50-day exponential moving average (EMA) (per Figure 1) are powerful facts suggesting that the opportunity for higher dollar prices is as good now as it has been in months. It may be worth noting that during this period of the greenback bouncing, gold and gold mining shares have been under increasing selling pressure. A number of commentators such as Tim Wood of Cycles News And Views have hinted recently that the "window of opportunity" for gold to make an intermediate-term low is between mid-March and mid-April. If that analysis proves accurate (and Wood's call of the date range for the most recently ended trading cycle low in the Dow industrials was accurate to the day), then a breakout to the upside from the dollar's current, short-term sideways consolidation may be the greenback's next move. |
Technical Writer for Technical Analysis of STOCKS & COMMODITIES magazine, Working-Money.com, and Traders.com Advantage.
| Title: | Technical Writer |
| Company: | Technical Analysis, Inc. |
| Address: | 4757 California Avenue SW |
| Seattle, WA 98116 | |
| Phone # for sales: | 206 938 0570 |
| Fax: | 206 938 1307 |
| Website: | www.Traders.com |
| E-mail address: | DPenn@traders.com |
Traders' Resource Links | |
| Charting the Stock Market: The Wyckoff Method -- Books | |
| Working-Money.com -- Online Trading Services | |
| Traders.com Advantage -- Online Trading Services | |
| Technical Analysis of Stocks & Commodities -- Publications and Newsletters | |
| Working Money, at Working-Money.com -- Publications and Newsletters | |
| Traders.com Advantage -- Publications and Newsletters | |
| Professional Traders Starter Kit -- Software | |
Click here for more information about our publications!
Comments
Date: 02/28/06Rank: 2Comment:
Date: 03/01/06Rank: 5Comment:
Date: 04/16/06Rank: 5Comment:

Request Information From Our Sponsors
- StockCharts.com, Inc.
- Candle Patterns
- Candlestick Charting Explained
- Intermarket Technical Analysis
- John Murphy on Chart Analysis
- John Murphy's Chart Pattern Recognition
- John Murphy's Market Message
- MurphyExplainsMarketAnalysis-Intermarket Analysis
- MurphyExplainsMarketAnalysis-Visual Analysis
- StockCharts.com
- Technical Analysis of the Financial Markets
- The Visual Investor
- VectorVest, Inc.
- Executive Premier Workshop
- One-Day Options Course
- OptionsPro
- Retirement Income Workshop
- Sure-Fire Trading Systems (VectorVest, Inc.)
- Trading as a Business Workshop
- VectorVest 7 EOD
- VectorVest 7 RealTime/IntraDay
- VectorVest AutoTester
- VectorVest Educational Services
- VectorVest OnLine
- VectorVest Options Analyzer
- VectorVest ProGraphics v6.0
- VectorVest ProTrader 7
- VectorVest RealTime Derby Tool
- VectorVest Simulator
- VectorVest Variator
- VectorVest Watchdog
