HOT TOPICS LIST
- MACD
- Fibonacci
- RSI
- Gann
- ADXR
- Stochastics
- Volume
- Triangles
- Futures
- Cycles
- Volatility
- ZIGZAG
- MESA
- Retracement
- Aroon
INDICATORS LIST
LIST OF TOPICS
PRINT THIS ARTICLE
by Gary Grosschadl
This specialty biopharmaceutical company leaps out of a consolidation pattern as it eyes previous resistance levels.
Position: Buy
Gary Grosschadl
Independent Canadian equities trader and technical analyst based in Peterborough
Ontario, Canada.
PRINT THIS ARTICLE
SYMMETRICAL TRIANGLE
Novavax Breaks Higher
02/28/06 07:58:56 AMby Gary Grosschadl
This specialty biopharmaceutical company leaps out of a consolidation pattern as it eyes previous resistance levels.
Position: Buy
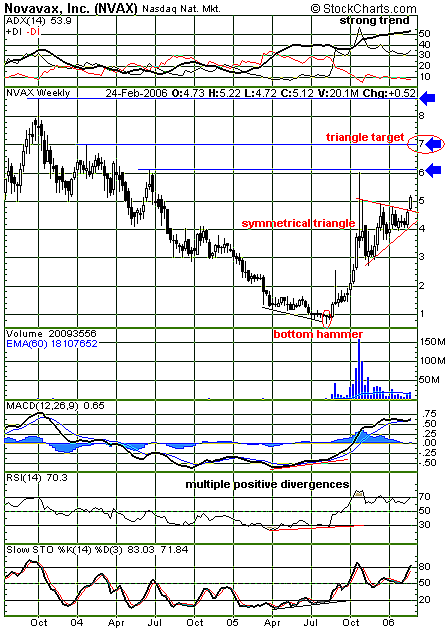
| It's been a long slide down on the weekly chart of Novavax (NVAX) since 2003 (Figure 1). Now, the bottom looks good as the first recognizable pattern forms in the shape of a symmetrical triangle. As the stock quickly rises off a bottom hammer candlestick, a period of consolidation is inevitable. Typically, volume dries up in a consolidation period, which is aptly displayed. A very bullish candle on the week breaks convincingly above the triangle, albeit on modestly higher volume. |
| Three upside targets are suggested, all relating to former high-water marks punctuated with long upper tails or shadows. Triangle breaks do have a measured upside target. The maximum width of the formation (5 - 2.80 = 2.20) is applied to the breakout point (4.80 + 2.20 = $7). This will likely be formidable resistance, as it also relates to an earlier resistance level. An interim target could be found near the $6 level where another consolidation could occur or the advance rejected. A super bullish move could eventually ensue, leading to the $8.80 region. |

|
| FIGURE 1: NOVAVAX, WEEKLY. The bottom looks solid for NVAX. |
| Graphic provided by: StockCharts.com. |
| |
| Several indicators are worthy of note. At the top of the chart, a strong trend is in place via a rising average directional moving index (ADX). When this line peaks and reverses, a retracement will follow. The indicators below the chart — the moving average convergence/divergence (MACD), the relative strength index (RSI), and the stochastics oscillator — are all in bullish territory. Note how well their earlier bullish (positive) divergences to price action accurately confirmed the bottom was in via the hammer candlestick. |
| NVAX has enough momentum to move forward higher. How it handles the first line of resistance will give clues to how robust this drive higher is. How far it goes before another consolidation, however, remains to be seen. |
Independent Canadian equities trader and technical analyst based in Peterborough
Ontario, Canada.
| Website: | www.whatsonsale.ca/financial.html |
| E-mail address: | gwg7@sympatico.ca |
Click here for more information about our publications!
Comments
Date: 02/28/06Rank: 5Comment:

Request Information From Our Sponsors
- VectorVest, Inc.
- Executive Premier Workshop
- One-Day Options Course
- OptionsPro
- Retirement Income Workshop
- Sure-Fire Trading Systems (VectorVest, Inc.)
- Trading as a Business Workshop
- VectorVest 7 EOD
- VectorVest 7 RealTime/IntraDay
- VectorVest AutoTester
- VectorVest Educational Services
- VectorVest OnLine
- VectorVest Options Analyzer
- VectorVest ProGraphics v6.0
- VectorVest ProTrader 7
- VectorVest RealTime Derby Tool
- VectorVest Simulator
- VectorVest Variator
- VectorVest Watchdog
- StockCharts.com, Inc.
- Candle Patterns
- Candlestick Charting Explained
- Intermarket Technical Analysis
- John Murphy on Chart Analysis
- John Murphy's Chart Pattern Recognition
- John Murphy's Market Message
- MurphyExplainsMarketAnalysis-Intermarket Analysis
- MurphyExplainsMarketAnalysis-Visual Analysis
- StockCharts.com
- Technical Analysis of the Financial Markets
- The Visual Investor
