HOT TOPICS LIST
- MACD
- Fibonacci
- RSI
- Gann
- ADXR
- Stochastics
- Volume
- Triangles
- Futures
- Cycles
- Volatility
- ZIGZAG
- MESA
- Retracement
- Aroon
INDICATORS LIST
LIST OF TOPICS
PRINT THIS ARTICLE
by David Penn
A breakout in the banking index suggests more upside is possible for the financial sector.
Position: N/A
David Penn
Technical Writer for Technical Analysis of STOCKS & COMMODITIES magazine, Working-Money.com, and Traders.com Advantage.
PRINT THIS ARTICLE
BREAKOUTS
Can't Beat The Banks
02/27/06 11:49:27 AMby David Penn
A breakout in the banking index suggests more upside is possible for the financial sector.
Position: N/A
| If you are a stock, is it better to be loathed or ignored? While it is financially fashionable to suggest that it is the true heroes of the market who are able to "buy 'em when they're cryin'," there is an argument that stocks that are loathed are loathed for a reason. And all the fundamentals in the world aren't going to help a stock that the buying community has turned against. But the ignored stock is something else altogether. It may be true that the passion of loathing must be respected, but when the buying community of traders, speculators, and investors has become complacent about a stock or sector, that is often a good time for contrarians to turn their attention in that stock or sector's direction. |

|
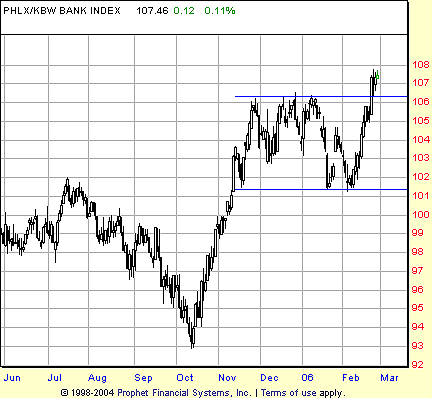
| FIGURE 1: PHILADELPHIA/KBW BANKING INDEX, DAILY. A three-month consolidation in banking stocks leads to a breakout in late February. |
| Graphic provided by: Prophet Financial, Inc. |
| |
| After all, from a technical perspective, the emblem of loathing is the sharp decline which, while often signaling that a buying opportunity may soon arise, for the time being still represents a sharp decline. As the saying goes, sometimes a cigar is just a cigar. And the loathing that embodies a sharp, nearly vertical decline in a market is best left to settle into, at least, a simmering contempt before cooler heads prevail. |
| But if the sharp decline is the emblem of loathing, then it is possible that the sideways correction is the sign of ignorance. Not "ignorance" in the ad hominem sense, but in a sense of unknowing and indecision that causes buyers to panic at resistance and sellers to give up at support. That certainly appears to have characterized trading in financial stocks over the past few months. The BKX, a major index of banking stocks, has been trapped in a four-point-plus trading range since late November. The fundamental explanations for this phenomenon have varied from references to the changing of the guard at the top of the Federal Reserve (Greenspan to Bernanke), the on-again/off-again inversion of the yield curve, and curiosity over the post-election curse (as I'll point out in an article for Working Money, the second year of a new Presidential term often provides what are euphemistically referred to as "great buying opportunities"). |

|
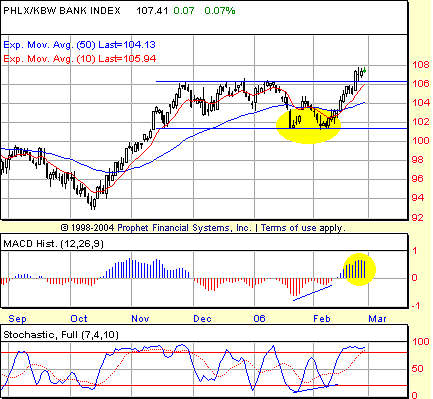
| FIGURE 2: PHILADELPHIA/KBW BANKING INDEX, DAILY. The size of the moving average convergence/divergence (MACD) histogram peak in late February is a testament to the strength of the breakout and the likelihood of further gains. Positive divergences in the histogram and the stochastic anticipated an upward resolution to this otherwise directionless, sideways correction. |
| Graphic provided by: Prophet Financial, Inc. |
| |
| Technicians may be forgiven for responding "all of that and none of it" because what has taken place in recent months has been clear to chartists: after a strong, 13-point run from mid-October to mid-November, the $BKX slipped into a sideways correction. Odds are that when this correction ends, an advance of more or less 13 points is likely to result. As I wrote recently for Traders.com Advantage, consolidations in trends often lead to more trend ("Consolidations In Trends," February 2, 2005). Clearly, this sort of "more trend" development is what the current market for banking stocks is trying to accomplish with a bottom in early February and a breakout from the consolidation late in the month — with a crossover of the 10-day exponential moving average (EMA) above the 50-day EMA. |
| There are two ways of looking at the near-term upside, as suggested by Figures 1 and 2. The first takes into account the rally that preceded the consolidation, a 13-point rally (from the October bottom to the top of the consolidation range), and posits that a 13-point rally starting from the low of the consolidation range will follow. This view provides for an upside target of about 114. The second approach simply adds the width of the consolidation range (approximately 5.25) to the value at the highest point of the range (106.55). This second method gives us a somewhat more modest upside target of 111.80. |
Technical Writer for Technical Analysis of STOCKS & COMMODITIES magazine, Working-Money.com, and Traders.com Advantage.
| Title: | Technical Writer |
| Company: | Technical Analysis, Inc. |
| Address: | 4757 California Avenue SW |
| Seattle, WA 98116 | |
| Phone # for sales: | 206 938 0570 |
| Fax: | 206 938 1307 |
| Website: | www.Traders.com |
| E-mail address: | DPenn@traders.com |
Traders' Resource Links | |
| Charting the Stock Market: The Wyckoff Method -- Books | |
| Working-Money.com -- Online Trading Services | |
| Traders.com Advantage -- Online Trading Services | |
| Technical Analysis of Stocks & Commodities -- Publications and Newsletters | |
| Working Money, at Working-Money.com -- Publications and Newsletters | |
| Traders.com Advantage -- Publications and Newsletters | |
| Professional Traders Starter Kit -- Software | |
Click here for more information about our publications!
Comments
Date: 02/28/06Rank: 3Comment:

Request Information From Our Sponsors
- StockCharts.com, Inc.
- Candle Patterns
- Candlestick Charting Explained
- Intermarket Technical Analysis
- John Murphy on Chart Analysis
- John Murphy's Chart Pattern Recognition
- John Murphy's Market Message
- MurphyExplainsMarketAnalysis-Intermarket Analysis
- MurphyExplainsMarketAnalysis-Visual Analysis
- StockCharts.com
- Technical Analysis of the Financial Markets
- The Visual Investor
- VectorVest, Inc.
- Executive Premier Workshop
- One-Day Options Course
- OptionsPro
- Retirement Income Workshop
- Sure-Fire Trading Systems (VectorVest, Inc.)
- Trading as a Business Workshop
- VectorVest 7 EOD
- VectorVest 7 RealTime/IntraDay
- VectorVest AutoTester
- VectorVest Educational Services
- VectorVest OnLine
- VectorVest Options Analyzer
- VectorVest ProGraphics v6.0
- VectorVest ProTrader 7
- VectorVest RealTime Derby Tool
- VectorVest Simulator
- VectorVest Variator
- VectorVest Watchdog
