HOT TOPICS LIST
- MACD
- Fibonacci
- RSI
- Gann
- ADXR
- Stochastics
- Volume
- Triangles
- Futures
- Cycles
- Volatility
- ZIGZAG
- MESA
- Retracement
- Aroon
INDICATORS LIST
LIST OF TOPICS
PRINT THIS ARTICLE
by Koos van der Merwe
Do you look at a weekly chart or a daily chart?
Position: Accumulate
Koos van der Merwe
Has been a technical analyst since 1969, and has worked as a futures and options trader with First Financial Futures in Johannesburg, South Africa.
PRINT THIS ARTICLE
ELLIOTT WAVE
Brightpoint Inc.: Opportunity To Buy?
02/27/06 11:23:12 AMby Koos van der Merwe
Do you look at a weekly chart or a daily chart?
Position: Accumulate
| Brightpoint (CELL) is a leading provider of outsourced services in the global wireless telecommunications and data industry. Innovative services provided include contract manufacturing, customized packaging, prepaid and ecommerce solutions, inventory management, distribution, and other outsourced services. |
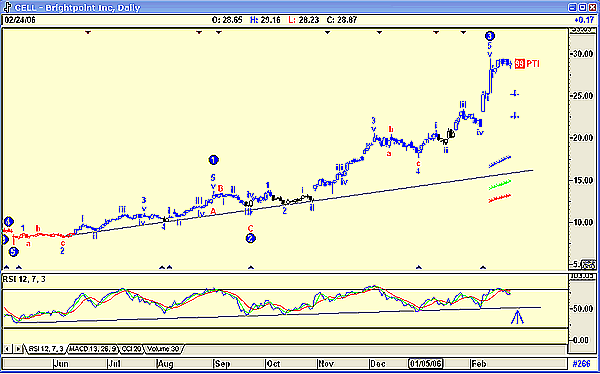
| Sounds good, especially if you believe that anything to do with the telecommunications industry is the wave of the future. Let us look at what a daily chart tells us (Figure 1). |

|
| FIGURE 1: BRIGHTPOINT INC., DAILY |
| Graphic provided by: AdvancedGET. |
| |
| Advanced GET suggests that Brightpoint could correct in a wave 4 correction. The PTI is suggesting a 99% certainty that this will occur with a wave 5 upward to follow a target of 42.89. The relative strength index (RSI) is confirming weakness, but rather than a drop below the 30 level, the RSI is suggesting that it could turn bullish once it tests the support line as shown by the blue arrow. So the daily chart is saying, "Watch me, and if my price tests the 25.22 level and the RSI gives a buy signal, then buy me, otherwise wait for the price to test the 22.58 level, as long as the RSI confirms the buy level." |

|
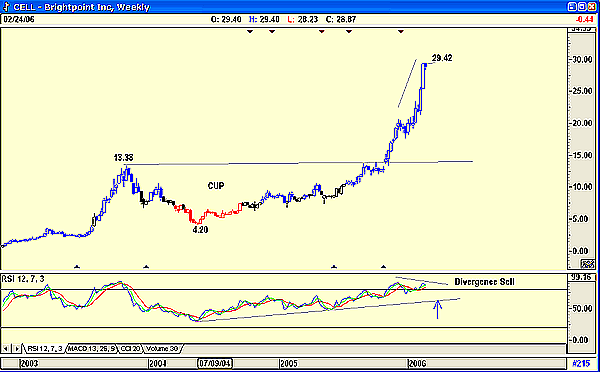
| FIGURE 2: BRIGHTPOINT INC., WEEKLY |
| Graphic provided by: AdvancedGET. |
| |
| The weekly chart (Figure 2) shows how a cup and handle formation developed, suggesting a target of $22.50 (13.38 - 4.20 = 9.18 + 13.38 = 22.50) should the price break above the $13.38 level. The price exceeded this target in two weeks of incredible strength, suggesting that a correction is now due. This is confirmed by the RSI divergence signal given, which is where the price makes a higher high, not confirmed by the indicator, which makes a lower high. Of course, the question is whether the support line of the RSI suggests a turning point. In any case, both the daily and weekly charts suggest that a correction is now due. When both charts move in the same direction, the investor should sit up and take notice and prepare a strategy. The two charts of Brightpoint Inc. represent an opportunity to buy the share at lower levels as identified by the chart. |
Has been a technical analyst since 1969, and has worked as a futures and options trader with First Financial Futures in Johannesburg, South Africa.
| Address: | 3256 West 24th Ave |
| Vancouver, BC | |
| Phone # for sales: | 6042634214 |
| E-mail address: | petroosp@gmail.com |
Click here for more information about our publications!
Comments
Date: 02/28/06Rank: 3Comment:

Request Information From Our Sponsors
- StockCharts.com, Inc.
- Candle Patterns
- Candlestick Charting Explained
- Intermarket Technical Analysis
- John Murphy on Chart Analysis
- John Murphy's Chart Pattern Recognition
- John Murphy's Market Message
- MurphyExplainsMarketAnalysis-Intermarket Analysis
- MurphyExplainsMarketAnalysis-Visual Analysis
- StockCharts.com
- Technical Analysis of the Financial Markets
- The Visual Investor
- VectorVest, Inc.
- Executive Premier Workshop
- One-Day Options Course
- OptionsPro
- Retirement Income Workshop
- Sure-Fire Trading Systems (VectorVest, Inc.)
- Trading as a Business Workshop
- VectorVest 7 EOD
- VectorVest 7 RealTime/IntraDay
- VectorVest AutoTester
- VectorVest Educational Services
- VectorVest OnLine
- VectorVest Options Analyzer
- VectorVest ProGraphics v6.0
- VectorVest ProTrader 7
- VectorVest RealTime Derby Tool
- VectorVest Simulator
- VectorVest Variator
- VectorVest Watchdog
