HOT TOPICS LIST
- MACD
- Fibonacci
- RSI
- Gann
- ADXR
- Stochastics
- Volume
- Triangles
- Futures
- Cycles
- Volatility
- ZIGZAG
- MESA
- Retracement
- Aroon
INDICATORS LIST
LIST OF TOPICS
PRINT THIS ARTICLE
by Dennis D. Peterson
Two commonly used indicators for determining a trending versus non-trending condition are vertical horizontal filter (VHF) and average directional index (ADX). Unfortunately they can give different answers.
Position: N/A
Dennis D. Peterson
Market index trading on a daily basis.
PRINT THIS ARTICLE
VERT HORIZ FILTER
VHF Versus ADX
08/29/00 09:51:10 AMby Dennis D. Peterson
Two commonly used indicators for determining a trending versus non-trending condition are vertical horizontal filter (VHF) and average directional index (ADX). Unfortunately they can give different answers.
Position: N/A
| VHF is calculated using the formula HC28-LC28 / SUM(ABS(cn-cn+1)), where the sum is the absolute value of the difference between consecutive daily closes for the last 28 days, HC28 is the highest close in the last 28 days and LC28 is the lowest close in the last 28 days. |
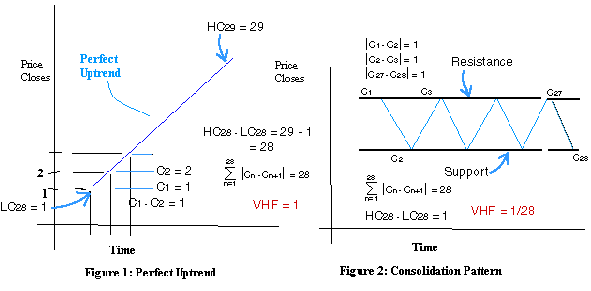
| ADX (see 8/7 article) is a calculation based on +DI and -DI, where DI, directional index is a calculation based on the amount of relative movement between the highs and lows on two consecutive days. VHF on the other hand chooses closes to measure movement, and by using the absolute value of daily close differences, it uses volatility to drive down the value of VHF. Let's take a closer look. Suppose a stock is in a perfect up trend. That is, there are no retracements. It just goes up every day. For VHF this means that the sum of the differences of daily closes, the denominator, exactly equals HC28-LC28. Which means VHF = 1 (Figure 1). |

|
| |
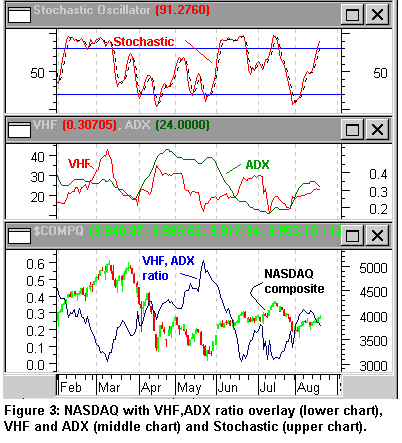
| It means the same thing for ADX since +DI encompasses all of the price movement. If, however, there is retracement, then VHF adds in the retracements since it uses the absolute differences. If retracement is "bouncing" between horizontal support and resistance lines the denominator for VHF is large, the numerator near zero, and VHF is a number near zero (Figure 2). This is exactly the condition wanted for the stochastic oscillator, a stock oscillating in a price channel. For ADX the result is the same only if the retracement for today is the same difference in price as yesterday's. But this is seldom, if ever, true. What you end up doing is trying to drive down accumulation value of one index, while raising the other. ADX will get there, but it could lag VHF. The Nasdaq composite has gone through several phases. The bottom chart of Figure 3 shows the Nasdaq overlaid with a measure I made to look at the difference between VHF and ADX. The measure is the Metastock formula ABS(VHF(C,28)*100-ADX(14)*2)/(VHF(C,28)*100+ADX(14)*2), that is, the absolute difference between VHF and ADX divided by the sum of VHF and ADX with adjustments made for scale. I tried several variations such as a simple ratio or just a difference between ADX and VHF, before I chose the ratio between the difference and the sum.  Figure 3: The strongest buy and sell signals from the stochastic indicator (upper chart)come when the Nasdaq is trendless. The middle chart shows ADX and VHF values for the Nasdaq. An indicator of the difference between ADX and VHF is shown as an overlay on the Nasdaq on the bottom chart. VHF does better to indicate a period of congestion and therefore a better time to use the stochastic oscillator. Graphic provided by: Metastock |
| Since both the ADX and VHF indicate the market was trendless between April and August, I used the stochastic indicator to determine enry and exit points. If you use ADX as a guide to validate a stochastic buy or sell signal, then the late-May dip of the Nasdaq is a questionable buy. In contrast if you use the VHF with the stochastic, you get a buy signal. The difference between VHF and ADX is at its greatest in late-May. They both say sell in mid-July and then buy again in late-July. Looking at April and May, it's hard to say that the Nasdaq is not in a downtrend. ADX tells us the Nasdaq is in a downtrend and VHF tells us the same thing but with a little less conviction. The big difference is June. VHF takes the June breakout and puts the breakout in the numerator and denominator of the calculation, essentially nullifying the breakout. Show me the trend! |
Market index trading on a daily basis.
| Title: | Staff Writer |
| Company: | Technical Analysis, Inc. |
| Address: | 4757 California Ave SW |
| Seattle, WA 98116-4499 | |
| Phone # for sales: | 206 938 0570 |
| Fax: | 206 938 1307 |
| Website: | www.traders.com |
| E-mail address: | dpeterson@traders.com |
Traders' Resource Links | |
| Charting the Stock Market: The Wyckoff Method -- Books | |
| Working-Money.com -- Online Trading Services | |
| Traders.com Advantage -- Online Trading Services | |
| Technical Analysis of Stocks & Commodities -- Publications and Newsletters | |
| Working Money, at Working-Money.com -- Publications and Newsletters | |
| Traders.com Advantage -- Publications and Newsletters | |
| Professional Traders Starter Kit -- Software | |
Click here for more information about our publications!
Comments
Date: / /Rank: 5Comment:
Date: / /Rank: 2Comment:
Date: / /Rank: 3Comment:
Date: / /Rank: 2Comment: Dennis Peterson,
I still unable to understand as how to use your ADX vs VHF charts. I plotted them into various charts and trying to understand as when it goes up and when it can come done. Need some more detail explaination from you. I am very much interested in learning your technique of analysis.
Thanks.
Thirumal
You can email me at
thiruthiru@hotmail.com or
thirumale@yahoo.com
Date: / /Rank: Comment: how one can determine the trend?I f Rsquared or vhf i moving up,which indicators can determinr whether its up or down trend?

Request Information From Our Sponsors
- StockCharts.com, Inc.
- Candle Patterns
- Candlestick Charting Explained
- Intermarket Technical Analysis
- John Murphy on Chart Analysis
- John Murphy's Chart Pattern Recognition
- John Murphy's Market Message
- MurphyExplainsMarketAnalysis-Intermarket Analysis
- MurphyExplainsMarketAnalysis-Visual Analysis
- StockCharts.com
- Technical Analysis of the Financial Markets
- The Visual Investor
- VectorVest, Inc.
- Executive Premier Workshop
- One-Day Options Course
- OptionsPro
- Retirement Income Workshop
- Sure-Fire Trading Systems (VectorVest, Inc.)
- Trading as a Business Workshop
- VectorVest 7 EOD
- VectorVest 7 RealTime/IntraDay
- VectorVest AutoTester
- VectorVest Educational Services
- VectorVest OnLine
- VectorVest Options Analyzer
- VectorVest ProGraphics v6.0
- VectorVest ProTrader 7
- VectorVest RealTime Derby Tool
- VectorVest Simulator
- VectorVest Variator
- VectorVest Watchdog
