HOT TOPICS LIST
- MACD
- Fibonacci
- RSI
- Gann
- ADXR
- Stochastics
- Volume
- Triangles
- Futures
- Cycles
- Volatility
- ZIGZAG
- MESA
- Retracement
- Aroon
INDICATORS LIST
LIST OF TOPICS
PRINT THIS ARTICLE
by Paolo Pezzutti
Prices are developing a congestion at the end of a long move up.
Position: Accumulate
Paolo Pezzutti
Author of the book "Trading the US Markets - A Comprehensive Guide to US Markets for International Traders and Investors" - Harriman House (July 2008)
PRINT THIS ARTICLE
TECHNICAL ANALYSIS
Goldman Sachs Is Consolidating After An All-Time High
02/27/06 11:44:54 AMby Paolo Pezzutti
Prices are developing a congestion at the end of a long move up.
Position: Accumulate
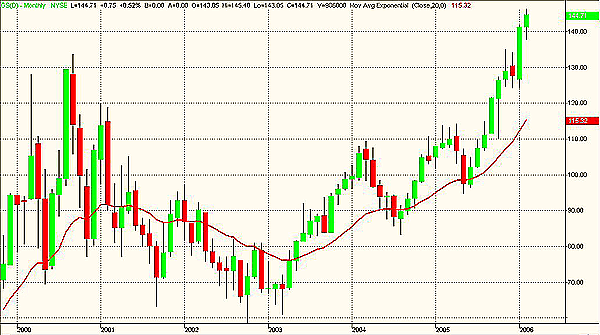
| Goldman Sachs (GS), the leader in global investment banking, asset management, and securities services worldwide, is very close to all-time highs (Figure 1). Note that prices are above the September 2001 high of $133.63. This type of performance is not so common in the marketplace. It is even more remarkable because Goldman Sachs printed a low of $58.57 in October 2002. Since then, prices have started an uptrend that is still ongoing. |

|
| FIGURE 1: GOLDMAN SACHS, MONTHLY. Prices are above the 2000 high. |
| Graphic provided by: TradeStation. |
| |
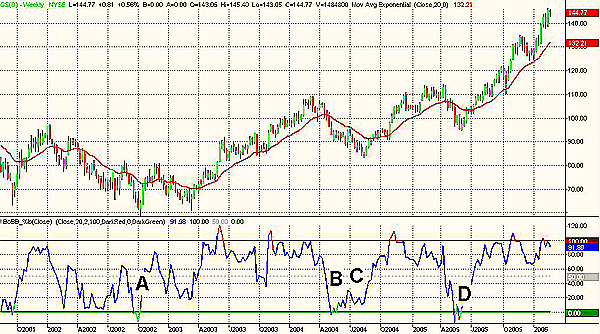
| In Figure 2, I highlighted the uptrend that started in 2002. The move is divided into three parts: a first leg between October 2002 and March 2004, followed by a sideways market until June 2005, and finally, the ongoing up leg. Note that there are only a few significant corrections that provided good entry opportunities in this time frame. I used the Bollinger %b to spot these entry opportunities. This indicator tells us where we are within the Bollinger Bands. Unlike typical oscillators -- for example, stochastics, which are bounded by zero and 100 -- %b can assume negative values and values above 100 when prices are outside of the bands. At 100 we are at the upper band, while at zero we are at the lower band. The %b went below zero in October 2002 (point A), then again in May 2004 at point B. Following its indications very likely resulted in a loss, because prices continued lower to print a lower low. At point C, in August 2004 it printed a positive divergence that provided an excellent entry point. The oversold indication provided at point D in May 2005 was also a good indication. During divergences, it is not possible to forecast if you need to wait it through before you open a trade. But what is possible is to manage your positions through strict risk control. |

|
| FIGURE 2: GOLDMAN SACHS, WEEKLY. During the past three years, a few corrections have allowed good entry points. |
| Graphic provided by: TradeStation. |
| |
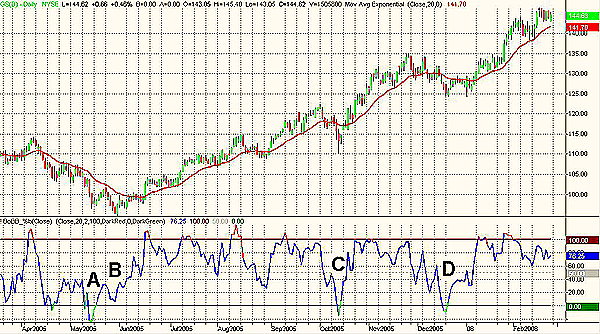
| In Figure 3, you see the daily chart. In this time frame, the last leg of the uptrend presented a few entry opportunities using the same %b indicator concept. At point A, in May 2005, %b went oversold. You had to wait for the positive divergence of point B to find a successful entry level. Another opportunity was provided at point C in October 2005 and the third at point D last December. |

|
| FIGURE 3: GOLDMAN SACHS, DAILY. The last leg of the up move started in June 2005. You can see the entry opportunities in this time frame. |
| Graphic provided by: TradeStation. |
| |
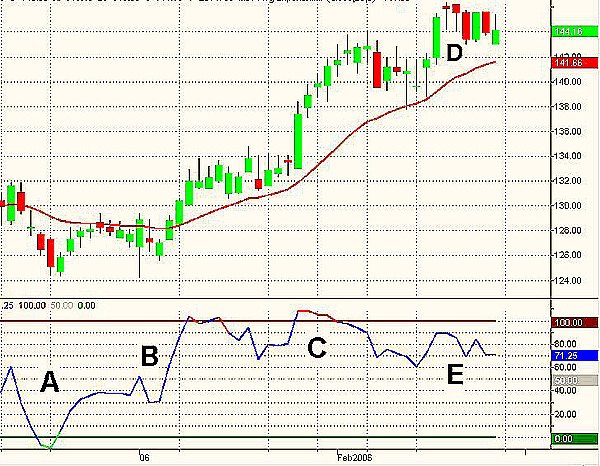
| In Figure 4, I focused on the last trading sessions. At point A you can see that %b was oversold. The stock printed a double low at point B, with the indicator signaling a significant positive divergence. The stock printed new highs at points C and E. Note the coincidence with the last new high, when the indicator printed a negative divergence. Risk is getting high at these levels. The two top bars printed on February 16-17 were two hanging man candlestick patterns. The real body is at the upper end of the range, while the lower shadow should be twice the real body and there should be a very short upper shadow. The longer the lower shadow, the shorter the upper shadow, and the smaller the real body, the more meaningful the bearish hanging man. The pattern is reinforced if the real body of the hanging man is black. The greater the down gap between the real body of the hanging man day and the opening the next day, the more likely the hanging man will be a top. Another bearish verification could be a black real body session with a lower close than the hanging man session's close. |

|
| FIGURE 4: GOLDMAN SACHS, DAILY. The stock is in a congestion after those two hanging man patterns have marked a top. |
| Graphic provided by: TradeStation. |
| |
| After reaching this top, prices are now developing a congestion. You could trade the breakout of the hanging man high or wait for the consolidation phase to present a short-term reversal formation to the upside that would bring prices to test their highs again. |
Author of the book "Trading the US Markets - A Comprehensive Guide to US Markets for International Traders and Investors" - Harriman House (July 2008)
| Address: | VIA ROBERTO AGO 26 POSTAL CODE 00166 |
| Rome, ITALY | |
| Phone # for sales: | +393357540708 |
| E-mail address: | pezzutti.paolo@tiscali.it |
Click here for more information about our publications!
Comments
Date: 02/28/06Rank: 3Comment:

Request Information From Our Sponsors
- StockCharts.com, Inc.
- Candle Patterns
- Candlestick Charting Explained
- Intermarket Technical Analysis
- John Murphy on Chart Analysis
- John Murphy's Chart Pattern Recognition
- John Murphy's Market Message
- MurphyExplainsMarketAnalysis-Intermarket Analysis
- MurphyExplainsMarketAnalysis-Visual Analysis
- StockCharts.com
- Technical Analysis of the Financial Markets
- The Visual Investor
- VectorVest, Inc.
- Executive Premier Workshop
- One-Day Options Course
- OptionsPro
- Retirement Income Workshop
- Sure-Fire Trading Systems (VectorVest, Inc.)
- Trading as a Business Workshop
- VectorVest 7 EOD
- VectorVest 7 RealTime/IntraDay
- VectorVest AutoTester
- VectorVest Educational Services
- VectorVest OnLine
- VectorVest Options Analyzer
- VectorVest ProGraphics v6.0
- VectorVest ProTrader 7
- VectorVest RealTime Derby Tool
- VectorVest Simulator
- VectorVest Variator
- VectorVest Watchdog
