HOT TOPICS LIST
- MACD
- Fibonacci
- RSI
- Gann
- ADXR
- Stochastics
- Volume
- Triangles
- Futures
- Cycles
- Volatility
- ZIGZAG
- MESA
- Retracement
- Aroon
INDICATORS LIST
LIST OF TOPICS
PRINT THIS ARTICLE
by David Penn
Consolidation in January leads to a big-time breakout in February.
Position: N/A
David Penn
Technical Writer for Technical Analysis of STOCKS & COMMODITIES magazine, Working-Money.com, and Traders.com Advantage.
PRINT THIS ARTICLE
BREAKOUTS
Telecom's Triumphant Breakout
02/24/06 07:59:28 AMby David Penn
Consolidation in January leads to a big-time breakout in February.
Position: N/A
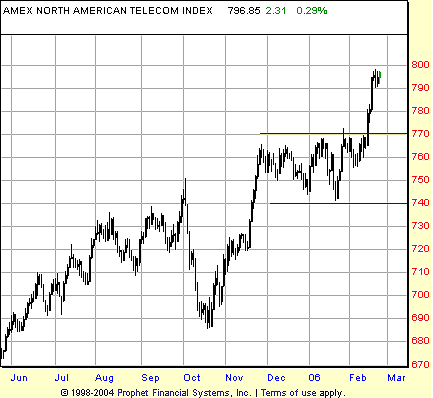
| Truth be told, telecommunications stocks have been on a tear for years. Save for multimonth corrections in the first half of 2004 and 2005, these stocks as measured by the AMEX North American telecom index ($XTC) have simply moved higher and higher since their bottom in October 2002. More recently, the telecom stocks have performed another impressive rebound. This time, the antecedent was a to-be-anticipated seasonal decline in October, which turned into a spirited rally by November (Figure 1). |

|
| FIGURE 1: AMEX NORTH AMERICAN TELECOMMUNICATIONS INDEX, DAILY. The $XTC rallied strongly from a seasonal bottom in October, moving into a sideways consolidation during December and January. The breakout in February so far appears as robust as the previous autumn advance. |
| Graphic provided by: Prophet Financial, Inc. |
| |
| That November rally ran out of gas in December as the telecom stocks slipped into a sideways consolidation -- along with the rest of the stock market. As I wrote recently for Traders.com Advantage ("Consolidations In Trends," February 2, 2006), consolidations that interrupt trends often are resolved with "more trend" in the direction of the preconsolidation movement of the market. Thus, a consolidation that appears in an uptrend is likely to be resolved by an uptrend, and a consolidation that appears in a downtrend is likely to be resolved by a downtrend. |
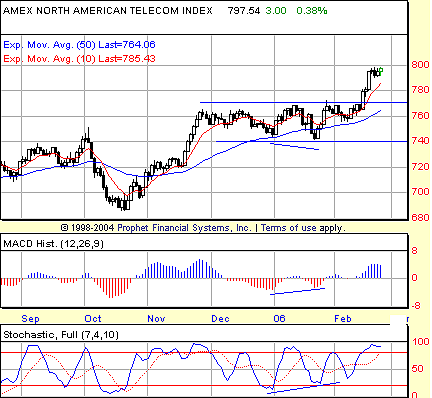
| But is there anything else a trader or speculator can rely on to anticipate whether a given consolidation will lead to a breakout or breakdown? One tool I have used with chart patterns is the indicator divergence, particularly with the stochastic and moving average convergence/divergence (MACD) histogram. In a sense, a rectangular consolidation is just another "directionless" chart pattern -- no different, really, than a symmetrical triangle or a diamond. This leads me to believe that some of the tools that help traders and speculators anticipate direction in the wake of "directionless" chart patterns like symmetrical triangles and diamonds might also be useful in anticipating direction from "directionless" rectangular consolidations. |

|
| FIGURE 2: AMEX NORTH AMERICAN TELECOMMUNICATIONS INDEX, DAILY. Positive divergences in the stochastic and MACD histogram form late December to late January anticipated the upward direction of the break from the consolidation range. |
| Graphic provided by: Prophet Financial, Inc. |
| |
| Note how the consolidation in January (actually, latest December and January) experiences a clear lower low. At the same time, however, both the MACD histogram and stochastic created higher lows (Figure 2). This created a classic positive divergence between prices in the $XTC and two key technical indicators. While this was hardly definitive proof that any breakout from the rectangular consolidation would be upward, it was a significant hint and, at a minimum, warned traders and speculators that late January was perhaps not the time to become overly bearish on the prospects for telecom stocks. |
| With a most recent close of 797.54, the telecom index is closing in on its minimum upside price target of 803. This figure is reached by taking the width of the consolidation at its widest point and adding that number to the value at the highest point of the consolidation. Interestingly, the sideways movement in the $XTC over the last few days suggests the sort of bull flag/bull pennant type of action that would be ideal for setting up another push higher toward that 803 mark. |
Technical Writer for Technical Analysis of STOCKS & COMMODITIES magazine, Working-Money.com, and Traders.com Advantage.
| Title: | Technical Writer |
| Company: | Technical Analysis, Inc. |
| Address: | 4757 California Avenue SW |
| Seattle, WA 98116 | |
| Phone # for sales: | 206 938 0570 |
| Fax: | 206 938 1307 |
| Website: | www.Traders.com |
| E-mail address: | DPenn@traders.com |
Traders' Resource Links | |
| Charting the Stock Market: The Wyckoff Method -- Books | |
| Working-Money.com -- Online Trading Services | |
| Traders.com Advantage -- Online Trading Services | |
| Technical Analysis of Stocks & Commodities -- Publications and Newsletters | |
| Working Money, at Working-Money.com -- Publications and Newsletters | |
| Traders.com Advantage -- Publications and Newsletters | |
| Professional Traders Starter Kit -- Software | |
Click here for more information about our publications!
Comments
Date: 02/27/06Rank: 5Comment:
Date: 02/28/06Rank: 3Comment:

Request Information From Our Sponsors
- VectorVest, Inc.
- Executive Premier Workshop
- One-Day Options Course
- OptionsPro
- Retirement Income Workshop
- Sure-Fire Trading Systems (VectorVest, Inc.)
- Trading as a Business Workshop
- VectorVest 7 EOD
- VectorVest 7 RealTime/IntraDay
- VectorVest AutoTester
- VectorVest Educational Services
- VectorVest OnLine
- VectorVest Options Analyzer
- VectorVest ProGraphics v6.0
- VectorVest ProTrader 7
- VectorVest RealTime Derby Tool
- VectorVest Simulator
- VectorVest Variator
- VectorVest Watchdog
- StockCharts.com, Inc.
- Candle Patterns
- Candlestick Charting Explained
- Intermarket Technical Analysis
- John Murphy on Chart Analysis
- John Murphy's Chart Pattern Recognition
- John Murphy's Market Message
- MurphyExplainsMarketAnalysis-Intermarket Analysis
- MurphyExplainsMarketAnalysis-Visual Analysis
- StockCharts.com
- Technical Analysis of the Financial Markets
- The Visual Investor
