HOT TOPICS LIST
- MACD
- Fibonacci
- RSI
- Gann
- ADXR
- Stochastics
- Volume
- Triangles
- Futures
- Cycles
- Volatility
- ZIGZAG
- MESA
- Retracement
- Aroon
INDICATORS LIST
LIST OF TOPICS
PRINT THIS ARTICLE
by Gary Grosschadl
As this NASDAQ 100 stock breaks higher, it validates the previous gap signal.
Position: Buy
Gary Grosschadl
Independent Canadian equities trader and technical analyst based in Peterborough
Ontario, Canada.
PRINT THIS ARTICLE
BREAKAWAY GAP
Cognizant's Breakaway Gap Confirms Higher
02/23/06 09:48:59 AMby Gary Grosschadl
As this NASDAQ 100 stock breaks higher, it validates the previous gap signal.
Position: Buy
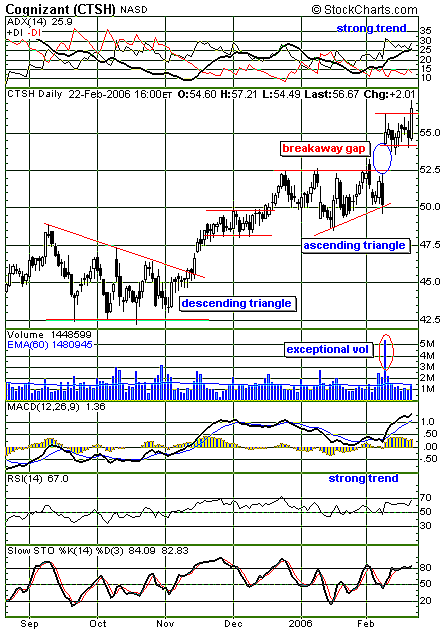
| Record fourth-quarter results announced February 9 provided the fuel to produce a breakaway gap for this IT services provider. These types of gaps tend to be exciting, as it takes good momentum to break past areas of congestion or consolidation. In this case, the consolidation took the form of an ascending triangle. High volume and exciting news accompanied this gap move. |
| Looking back on this daily chart (Figure 1), the ascent started with a breakout from a descending triangle, which led to a higher consolidation pattern via a rectangle. This morphed into a longer and larger pattern by way of an ascending triangle. Ascending triangles have a bullish bias, whereas descending triangles are often considered to have a bearish bias. However, the bottom line is the way it breaks. Here, we see a bullish outcome on both patterns. |

|
| FIGURE 1: COGNIZANT, DAILY. A breakaway gap may fuel an exciting rise. |
| Graphic provided by: StockCharts.com. |
| |
| Today's upside break of the brief consolidation rectangle confirms the very bullish breakaway gap. There is no upside measure of further targets as the stock enjoys all-time highs. As long as the top of the gap holds support at roughly $54, the bulls prevail. Ideally, the top of the triangle at $56.50 becomes future support for added bullishness. As this stock appears to be launching off the breakaway gap, the stock could make dramatic moves higher. |
| Several indicators also reflect a strong trend in place. The average directional movement index (ADX) (top of chart) shows an ideal bullish stance with good upslope above the 25 area. The moving average convergence/divergence (MACD) shows good strength above its zero line, as does the relative strength index (RSI), with strength above the key 50 zone. Note the stochastics oscillator is in overbought territory; but when a strong trend is in place, this indicator can remain in an uptrend. |
Independent Canadian equities trader and technical analyst based in Peterborough
Ontario, Canada.
| Website: | www.whatsonsale.ca/financial.html |
| E-mail address: | gwg7@sympatico.ca |
Click here for more information about our publications!
Comments
Date: 02/27/06Rank: 5Comment:

Request Information From Our Sponsors
- StockCharts.com, Inc.
- Candle Patterns
- Candlestick Charting Explained
- Intermarket Technical Analysis
- John Murphy on Chart Analysis
- John Murphy's Chart Pattern Recognition
- John Murphy's Market Message
- MurphyExplainsMarketAnalysis-Intermarket Analysis
- MurphyExplainsMarketAnalysis-Visual Analysis
- StockCharts.com
- Technical Analysis of the Financial Markets
- The Visual Investor
- VectorVest, Inc.
- Executive Premier Workshop
- One-Day Options Course
- OptionsPro
- Retirement Income Workshop
- Sure-Fire Trading Systems (VectorVest, Inc.)
- Trading as a Business Workshop
- VectorVest 7 EOD
- VectorVest 7 RealTime/IntraDay
- VectorVest AutoTester
- VectorVest Educational Services
- VectorVest OnLine
- VectorVest Options Analyzer
- VectorVest ProGraphics v6.0
- VectorVest ProTrader 7
- VectorVest RealTime Derby Tool
- VectorVest Simulator
- VectorVest Variator
- VectorVest Watchdog
