HOT TOPICS LIST
- MACD
- Fibonacci
- RSI
- Gann
- ADXR
- Stochastics
- Volume
- Triangles
- Futures
- Cycles
- Volatility
- ZIGZAG
- MESA
- Retracement
- Aroon
INDICATORS LIST
LIST OF TOPICS
PRINT THIS ARTICLE
by David Penn
Has the "never too high to buy" thesis struck again?
Position: N/A
David Penn
Technical Writer for Technical Analysis of STOCKS & COMMODITIES magazine, Working-Money.com, and Traders.com Advantage.
PRINT THIS ARTICLE
Can Copper Be Topped?
02/23/06 08:30:07 AMby David Penn
Has the "never too high to buy" thesis struck again?
Position: N/A
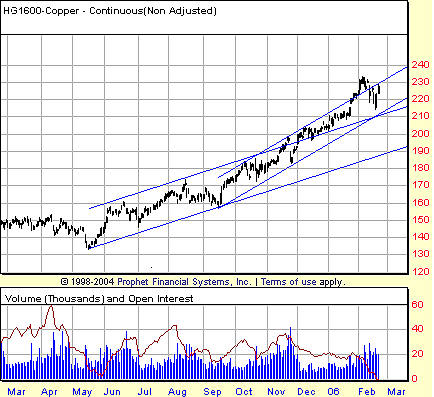
| Although his name escapes me, the author of a book on trading futures I once read suggested that novice futures traders might find the market for copper to be among those best suited for beginners. Well, any fledgling trader who took that advice at any time over the past several months probably has to be thinking quite warmly indeed of the market for copper futures, as Figure 1 shows. |

|
| FIGURE 1: COPPER FUTURES, CONTINUOUS, DAILY. Bottoming in the late spring of 2005, copper futures have been on a long, easy ride higher ever since. Note the acceleration in the advance that begins with the late November–early December breakout from the initial trend channel. |
| Graphic provided by: Prophet Financial, Inc. |
| |
| One excellent way to examine a market that's been in bull market mode for longer than anyone thought was sustainable is through the BOSO methodology I first discussed in Working Money.com ("BOSO," October 5, 2005). "BOSO" — which is derived from the work and observations of Price Headley of BigTrends.com — stands for "buying overbought and selling oversold." It is a way to remind ourselves of that eternal point from legendary trader Jesse Livermore, that "stocks are never too high to buy and never too low to sell." |
| On examining copper futures through the lens of the BOSO screen (the default stochastic and extra-long period Bollinger Bands), we see that copper made a stochastic breakout (that is, "became overbought") back in earliest November (basis March) with a close at 178.80. From that point until the present time, the BOSO methodology has yet to stop the position out (per BOSO, the long position would be stopped out if the market slipped below 80 in the stochastic and if there was a subsequent close below the low of the session that marked the move below 80 in the stochastic). This includes the recent selloff that saw copper futures correct back to their 50-day exponential moving average (EMA) — in at 178.80 and at 226.45 and counting, still in. |

|
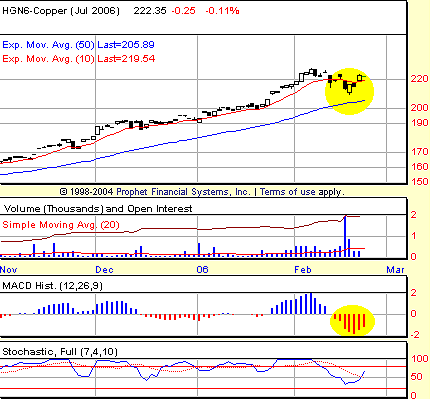
| FIGURE 2: JULY COPPER FUTURES, DAILY. The big dip in the MACD histogram is more likely a buying opportunity rather than a warning of lower prices to come. This is true as long as the market remains above its 50-day EMA. |
| Graphic provided by: Prophet Financial, Inc. |
| |
| That kind of BOSO analysis makes me believe that the concern about copper's correction — and the correction in semiconductor stocks, to a degree — may be a bit overwrought. Even as the BOSO method provided potential stop-out points during its December-to-present run, those stop-loss levels were never reached and the copper market only edged higher and higher. |
| More immediately, copper futures look as if they are rallying from their most recent correction in mid-February. That correction approached — but did not seriously test — the 50-day EMA. Even though the correction created the sort of deep moving average convergence/divergence (MACD) histogram trough that can often signal trouble, the fact that the trough was formed while prices were still significantly above the 50-day EMA (and not that far below the 10-day EMA) makes the trough that much less of a threat. It should also be pointed out that the MACD histogram peak formed just before the correction in mid-February is a particularly bullish sign that the price highs that accompanied the histogram peak are likely to be exceeded (Figure 2). |
Technical Writer for Technical Analysis of STOCKS & COMMODITIES magazine, Working-Money.com, and Traders.com Advantage.
| Title: | Technical Writer |
| Company: | Technical Analysis, Inc. |
| Address: | 4757 California Avenue SW |
| Seattle, WA 98116 | |
| Phone # for sales: | 206 938 0570 |
| Fax: | 206 938 1307 |
| Website: | www.Traders.com |
| E-mail address: | DPenn@traders.com |
Traders' Resource Links | |
| Charting the Stock Market: The Wyckoff Method -- Books | |
| Working-Money.com -- Online Trading Services | |
| Traders.com Advantage -- Online Trading Services | |
| Technical Analysis of Stocks & Commodities -- Publications and Newsletters | |
| Working Money, at Working-Money.com -- Publications and Newsletters | |
| Traders.com Advantage -- Publications and Newsletters | |
| Professional Traders Starter Kit -- Software | |
Click here for more information about our publications!
Comments
Date: 02/27/06Rank: 5Comment:

Request Information From Our Sponsors
- StockCharts.com, Inc.
- Candle Patterns
- Candlestick Charting Explained
- Intermarket Technical Analysis
- John Murphy on Chart Analysis
- John Murphy's Chart Pattern Recognition
- John Murphy's Market Message
- MurphyExplainsMarketAnalysis-Intermarket Analysis
- MurphyExplainsMarketAnalysis-Visual Analysis
- StockCharts.com
- Technical Analysis of the Financial Markets
- The Visual Investor
- VectorVest, Inc.
- Executive Premier Workshop
- One-Day Options Course
- OptionsPro
- Retirement Income Workshop
- Sure-Fire Trading Systems (VectorVest, Inc.)
- Trading as a Business Workshop
- VectorVest 7 EOD
- VectorVest 7 RealTime/IntraDay
- VectorVest AutoTester
- VectorVest Educational Services
- VectorVest OnLine
- VectorVest Options Analyzer
- VectorVest ProGraphics v6.0
- VectorVest ProTrader 7
- VectorVest RealTime Derby Tool
- VectorVest Simulator
- VectorVest Variator
- VectorVest Watchdog
