HOT TOPICS LIST
- MACD
- Fibonacci
- RSI
- Gann
- ADXR
- Stochastics
- Volume
- Triangles
- Futures
- Cycles
- Volatility
- ZIGZAG
- MESA
- Retracement
- Aroon
INDICATORS LIST
LIST OF TOPICS
PRINT THIS ARTICLE
by Arthur Hill
After becoming oversold, Google is finding support at a logical level and getting a bounce. Is it sustainable?
Position: Hold
Arthur Hill
Arthur Hill is currently editor of TDTrader.com, a website specializing in trading strategies, sector/industry specific breadth stats and overall technical analysis. He passed the Society of Technical Analysts (STA London) diploma exam with distinction is a Certified Financial Technician (CFTe). Prior to TD Trader, he was the Chief Technical Analyst for Stockcharts.com and the main contributor to the ChartSchool.
PRINT THIS ARTICLE
OVERBOUGHT OVERSOLD
Google Finally Gets Oversold
02/23/06 08:11:52 AMby Arthur Hill
After becoming oversold, Google is finding support at a logical level and getting a bounce. Is it sustainable?
Position: Hold
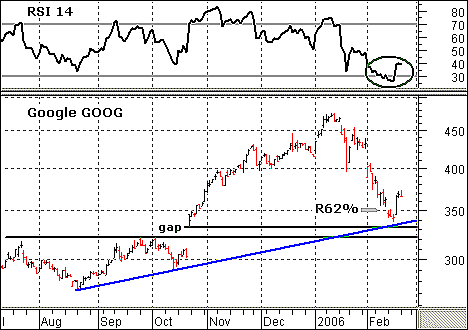
| Google (GOOG) has not been around that long, but it is still pretty unusual for a stock not to become oversold for more than 18 months. The stock started trading in August 2004 and its relative strength index (RSI) did not reach oversold levels until February 2006. For the past 18 months, RSI managed to bounce each time the indicator dipped below 40. Does the move below 30 signal a significant trend change, or does this represent a buying opportunity? For an answer, let's look at the price chart (Figure 1). |

|
| FIGURE 1: GOOGLE. Does the move below 30 signal a change of trend? |
| Graphic provided by: MetaStock. |
| |
| First, the long-term trend for Google is still up. The stock took a big hit in 2006 but remains well above summer support. In fact, the current decline found support right where a technical analyst would expect (Figure 2). The move retraced a Fibonacci level of 62% of the prior advance. In addition, the October gap and August trendline combined to offer support around 330–340. The decline was certainly drastic. However, when compared to the prior move, it still looks like a correction that retraced a portion of the August–January advance. |

|
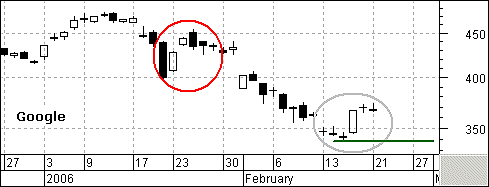
| FIGURE 2: GOOGLE, DAILY. Overall, the long-term trend for GOOG still appears to be upward. |
| Graphic provided by: MetaStock. |
| |
| Follow-through is the key. The stock gapped down on February 13, formed three doji, and then filled the gap with a long white candlestick (gray oval). This is quite positive price action. However, it could be just an oversold bounce, and follow-through is important for confirmation. The late January bounce lacked follow-through and failed around 450 (red circle). The stock formed two doji after the long white candlestick, and I would like to see follow-through above 375 to consider this bounce sustainable. |
Arthur Hill is currently editor of TDTrader.com, a website specializing in trading strategies, sector/industry specific breadth stats and overall technical analysis. He passed the Society of Technical Analysts (STA London) diploma exam with distinction is a Certified Financial Technician (CFTe). Prior to TD Trader, he was the Chief Technical Analyst for Stockcharts.com and the main contributor to the ChartSchool.
| Title: | Editor |
| Company: | TDTrader.com |
| Address: | Willem Geetsstraat 17 |
| Mechelen, B2800 | |
| Phone # for sales: | 3215345465 |
| Website: | www.tdtrader.com |
| E-mail address: | arthurh@tdtrader.com |
Traders' Resource Links | |
| TDTrader.com has not added any product or service information to TRADERS' RESOURCE. | |
Click here for more information about our publications!
Comments
Date: 02/26/06Rank: 5Comment:
Date: 02/27/06Rank: 4Comment:

|

Request Information From Our Sponsors
- StockCharts.com, Inc.
- Candle Patterns
- Candlestick Charting Explained
- Intermarket Technical Analysis
- John Murphy on Chart Analysis
- John Murphy's Chart Pattern Recognition
- John Murphy's Market Message
- MurphyExplainsMarketAnalysis-Intermarket Analysis
- MurphyExplainsMarketAnalysis-Visual Analysis
- StockCharts.com
- Technical Analysis of the Financial Markets
- The Visual Investor
- VectorVest, Inc.
- Executive Premier Workshop
- One-Day Options Course
- OptionsPro
- Retirement Income Workshop
- Sure-Fire Trading Systems (VectorVest, Inc.)
- Trading as a Business Workshop
- VectorVest 7 EOD
- VectorVest 7 RealTime/IntraDay
- VectorVest AutoTester
- VectorVest Educational Services
- VectorVest OnLine
- VectorVest Options Analyzer
- VectorVest ProGraphics v6.0
- VectorVest ProTrader 7
- VectorVest RealTime Derby Tool
- VectorVest Simulator
- VectorVest Variator
- VectorVest Watchdog
