HOT TOPICS LIST
- MACD
- Fibonacci
- RSI
- Gann
- ADXR
- Stochastics
- Volume
- Triangles
- Futures
- Cycles
- Volatility
- ZIGZAG
- MESA
- Retracement
- Aroon
INDICATORS LIST
LIST OF TOPICS
PRINT THIS ARTICLE
by David Penn
Positive divergences in the MACD histogram and stochastic suggest opportunities in the hourly chart of July coffee.
Position: N/A
David Penn
Technical Writer for Technical Analysis of STOCKS & COMMODITIES magazine, Working-Money.com, and Traders.com Advantage.
PRINT THIS ARTICLE
REVERSAL
Here Comes Coffee
02/22/06 11:33:49 AMby David Penn
Positive divergences in the MACD histogram and stochastic suggest opportunities in the hourly chart of July coffee.
Position: N/A
| I last looked at coffee futures in early January ("A Breakout In Coffee," Traders.com Advantage, January 9, 2006). At the time, I suggested that an "Eve & Eve" double bottom beginning in September 2005 pointed to a rally in coffee futures that could take prices as high as $1.34 in a minimum move. See Figure 1. |

|
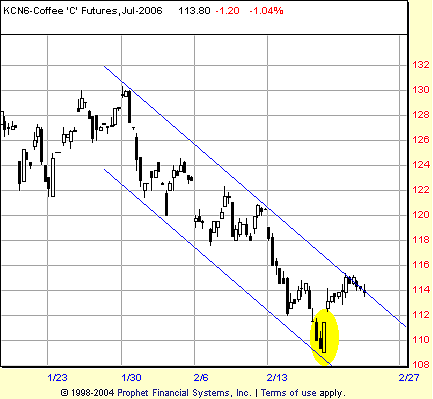
| FIGURE 1: JULY COFFEE FUTURES, HOURLY. This bullish engulfing pattern in the hourly chart arrives as the market is testing the lower boundary of a multiday trend channel for support. It signals the possibility of a bounce — if not an outright reversal — after several sessions dominated by selling. |
| Graphic provided by: Prophet Financial, Inc. |
| |
| At the time, March coffee was trading at $1.17. Unfortunately for those long the commodity, the breakout from the double bottom rallied as high as $1.24 (closing high on January 27) before rolling over and pulling back toward the breakout area of $1.12. To make matters worse, the breakout level did not provide resistance for the falling market, which slipped as low as $1.04. |
| This failure notwithstanding — one that was telegraphed amply by negative stochastic and moving average convergence/divergence histogram (MACDH) divergences throughout the second half of January — opportunity still may exist for bulls who took profits anywhere along coffee's 12-cent ride from early January breakout to late January closing high (note that a 12-cent move in coffee is worth approximately $4,500). |

|
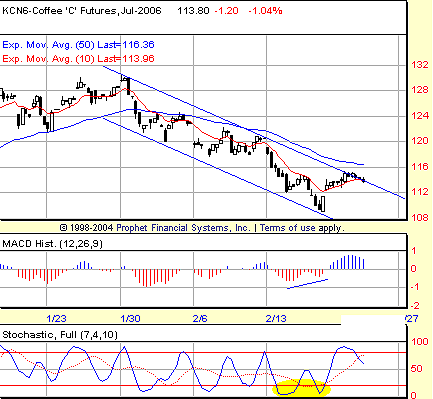
| FIGURE 2: JULY COFFEE FUTURES, HOURLY. Positive divergences in the stochastic and MACDH anticipate the bounce in coffee futures shown in this hourly chart. Breaking out above the upper boundary of the trend channel remains one of the key hurdles for the nascent advance, however. |
| Graphic provided by: Prophet Financial, Inc. |
| |
| Those opportunities — such as they exist — are more readily apparent in the hourly chart of coffee futures than in the daily. On the daily chart, the futures (here, basis July) are coping with a breakout level at roughly $1.12 that has become resistance now that the futures have moved below it. On the hourly chart, a bullish engulfing pattern combines with positive MACD histogram and stochastic divergences to suggest that the coffee correction could be closer to an end than a beginning. See Figure 2. |
| If nothing else, these positive divergences establish another line in the sand for bulls. The divergences on the hourly level suggest that a bottom is in, which means that traders and speculators can set stop-loss levels appropriately based on that bottom. And should that level be exceeded to the downside, traders can prepare themselves for the even steeper declines that are likely to follow. |
Technical Writer for Technical Analysis of STOCKS & COMMODITIES magazine, Working-Money.com, and Traders.com Advantage.
| Title: | Technical Writer |
| Company: | Technical Analysis, Inc. |
| Address: | 4757 California Avenue SW |
| Seattle, WA 98116 | |
| Phone # for sales: | 206 938 0570 |
| Fax: | 206 938 1307 |
| Website: | www.Traders.com |
| E-mail address: | DPenn@traders.com |
Traders' Resource Links | |
| Charting the Stock Market: The Wyckoff Method -- Books | |
| Working-Money.com -- Online Trading Services | |
| Traders.com Advantage -- Online Trading Services | |
| Technical Analysis of Stocks & Commodities -- Publications and Newsletters | |
| Working Money, at Working-Money.com -- Publications and Newsletters | |
| Traders.com Advantage -- Publications and Newsletters | |
| Professional Traders Starter Kit -- Software | |
Click here for more information about our publications!
Comments
Date: 02/23/06Rank: 3Comment:
Date: 02/28/06Rank: 2Comment:
Date: 04/16/06Rank: 5Comment:

Request Information From Our Sponsors
- StockCharts.com, Inc.
- Candle Patterns
- Candlestick Charting Explained
- Intermarket Technical Analysis
- John Murphy on Chart Analysis
- John Murphy's Chart Pattern Recognition
- John Murphy's Market Message
- MurphyExplainsMarketAnalysis-Intermarket Analysis
- MurphyExplainsMarketAnalysis-Visual Analysis
- StockCharts.com
- Technical Analysis of the Financial Markets
- The Visual Investor
- VectorVest, Inc.
- Executive Premier Workshop
- One-Day Options Course
- OptionsPro
- Retirement Income Workshop
- Sure-Fire Trading Systems (VectorVest, Inc.)
- Trading as a Business Workshop
- VectorVest 7 EOD
- VectorVest 7 RealTime/IntraDay
- VectorVest AutoTester
- VectorVest Educational Services
- VectorVest OnLine
- VectorVest Options Analyzer
- VectorVest ProGraphics v6.0
- VectorVest ProTrader 7
- VectorVest RealTime Derby Tool
- VectorVest Simulator
- VectorVest Variator
- VectorVest Watchdog
