HOT TOPICS LIST
- MACD
- Fibonacci
- RSI
- Gann
- ADXR
- Stochastics
- Volume
- Triangles
- Futures
- Cycles
- Volatility
- ZIGZAG
- MESA
- Retracement
- Aroon
INDICATORS LIST
LIST OF TOPICS
PRINT THIS ARTICLE
by David Penn
What does the Dow theory buy signal mean for the rest of the market?
Position: N/A
David Penn
Technical Writer for Technical Analysis of STOCKS & COMMODITIES magazine, Working-Money.com, and Traders.com Advantage.
PRINT THIS ARTICLE
BREAKOUTS
Bounce In February
02/21/06 11:32:30 AMby David Penn
What does the Dow theory buy signal mean for the rest of the market?
Position: N/A
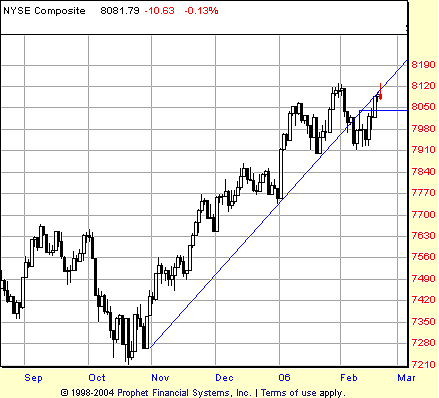
| What's to like about the Dow industrials' breakout in mid-February, dubbed variously the "Bernanke Bounce" ("The S&P 500's Bernanke Bounce," Traders.com Advantage, February 9, 2006) and the "Valentine's Day Breakout"? The semiconductors are not leading -- which means that the NASDAQ is not leading. The very reliable NYSE Composite has failed to confirm the Dow's new highs (Figure 1). And many formerly leading stocks -- such as Motorola (MOT) and Apple (AAPL) -- have been under significant selling pressure over the last month. |

|
| FIGURE 1: NEW YORK STOCK EXCHANGE COMPOSITE, DAILY. Negative divergences in the MACD histogram and stochastic suggest that the NYSE is running out of steam as it advances higher. Note that prices that once tested the October–February trendline for support are now testing it for resistance. |
| Graphic provided by: Prophet Financial, Inc. |
| |
| The industrials do have the transports going for them ("Confirming Industrials," Traders.com Advantage, February 17, 2006). In fact, each of the past four months (November and December 2005 and January and February 2006) has featured new, all-time highs in the Dow transports. Per Dow theory, what has happened in recent days -- the industrials' confirmation of the transports move to new, year-to-date highs -- constitutes a Dow theory buy signal. |
| If that Dow theory buy signal is to be taken at its word, if indeed the Dow transports and industrials are signaling that higher prices are ahead for stocks, then there should be signs of incipient bullishness everywhere. These signs should be especially abundant in those market sectors that tend to lead major advances. These sectors include semiconductors, airlines (which lead the market higher in autumn 2005), small-cap indexes like the Russell 2000, and -- as far as breadth is concerned -- the stock universe that is the NYSE. |
| The NYSE has fallen below a trendline that has provided support for the market's rally since late October. This correction has provided a support test level at 7910, a level that corresponds not coincidentally with the 50-day exponential moving average (EMA) and the lows of mid-January. Many of the sessions during that correction ended with closing prices off the lows, suggesting that buyers were able to fend off the most excessive selling pressure of the day. That the NYSE has moved back above the 10-day ("trading") EMA is more evidence that buyers are remaining strong, in spite of the failure of the NYSE to make new highs along with the Dow industrials and transports. |

|
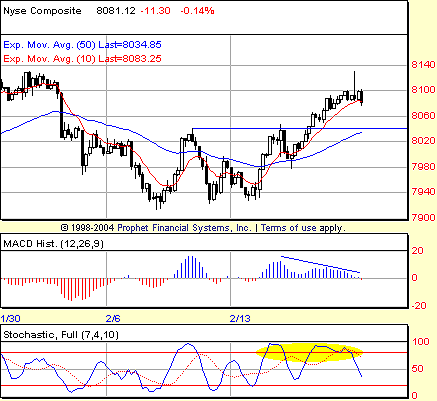
| FIGURE 2: NEW YORK STOCK EXCHANGE COMPOSITE, HOURLY. Hourly MACD histogram sell signals on February 14 and 15 were not met with significant downside follow-through. "Hound of the Baskervilles" signal? Or wil the negative divergences in the MACD histogram and stochastic catch up with the rally and force a pullback, at least to the breakout level of 8040? |
| Graphic provided by: Prophet Financial, Inc. |
| |
| The hourly chart can often be a good insight into what is building on the daily chart. At the hourly level, the NYSE appears to have broken free from a bottom that was created over the first two weeks of February (Figure 2). The breakout level appears to be at 8040, a level that the market twice attempted to take out (late on February 9, early on February 15). It looks as if this level was taken out and tested on February 16 and the market has moved higher since. There have been a few offers created with the negative divergences that have popped up over the course of the rally: once on February 16 and twice on February 17. But there was no significant follow-through selling, and the market never reached those offer levels -- as of this writing. Pullback to 8040 or no, if the NYSE has indeed broken out from a bottom in the hourly chart, then confirmation of the Dow's move to new highs could be in the cards. Using trader Stan Weinstein's swing rule to estimate a minimum upside rally from the bottom gives us a 120-point breakout in the NYSE and an initial target of 8160. |
Technical Writer for Technical Analysis of STOCKS & COMMODITIES magazine, Working-Money.com, and Traders.com Advantage.
| Title: | Technical Writer |
| Company: | Technical Analysis, Inc. |
| Address: | 4757 California Avenue SW |
| Seattle, WA 98116 | |
| Phone # for sales: | 206 938 0570 |
| Fax: | 206 938 1307 |
| Website: | www.Traders.com |
| E-mail address: | DPenn@traders.com |
Traders' Resource Links | |
| Charting the Stock Market: The Wyckoff Method -- Books | |
| Working-Money.com -- Online Trading Services | |
| Traders.com Advantage -- Online Trading Services | |
| Technical Analysis of Stocks & Commodities -- Publications and Newsletters | |
| Working Money, at Working-Money.com -- Publications and Newsletters | |
| Traders.com Advantage -- Publications and Newsletters | |
| Professional Traders Starter Kit -- Software | |
Click here for more information about our publications!
Comments
Date: 02/22/06Rank: 5Comment:

Request Information From Our Sponsors
- StockCharts.com, Inc.
- Candle Patterns
- Candlestick Charting Explained
- Intermarket Technical Analysis
- John Murphy on Chart Analysis
- John Murphy's Chart Pattern Recognition
- John Murphy's Market Message
- MurphyExplainsMarketAnalysis-Intermarket Analysis
- MurphyExplainsMarketAnalysis-Visual Analysis
- StockCharts.com
- Technical Analysis of the Financial Markets
- The Visual Investor
- VectorVest, Inc.
- Executive Premier Workshop
- One-Day Options Course
- OptionsPro
- Retirement Income Workshop
- Sure-Fire Trading Systems (VectorVest, Inc.)
- Trading as a Business Workshop
- VectorVest 7 EOD
- VectorVest 7 RealTime/IntraDay
- VectorVest AutoTester
- VectorVest Educational Services
- VectorVest OnLine
- VectorVest Options Analyzer
- VectorVest ProGraphics v6.0
- VectorVest ProTrader 7
- VectorVest RealTime Derby Tool
- VectorVest Simulator
- VectorVest Variator
- VectorVest Watchdog
