HOT TOPICS LIST
- MACD
- Fibonacci
- RSI
- Gann
- ADXR
- Stochastics
- Volume
- Triangles
- Futures
- Cycles
- Volatility
- ZIGZAG
- MESA
- Retracement
- Aroon
INDICATORS LIST
LIST OF TOPICS
PRINT THIS ARTICLE
by Paolo Pezzutti
The price of this high-tech stock is in a consolidation phase in the daily time frame.
Position: Hold
Paolo Pezzutti
Author of the book "Trading the US Markets - A Comprehensive Guide to US Markets for International Traders and Investors" - Harriman House (July 2008)
PRINT THIS ARTICLE
TECHNICAL ANALYSIS
Advanced Micro Devices: A Pause In The Parabolic Rally
02/21/06 10:03:32 AMby Paolo Pezzutti
The price of this high-tech stock is in a consolidation phase in the daily time frame.
Position: Hold
| The principal activity of Advanced Micro Devices (AMD) is to design, manufacture, and market industry-standard semiconductor products. AMD is the main rival of Intel, which fell lately on concerns on a slowing PC market after 14 months of robust growth as it loses market share to AMD. Intel is affected by an ever-aggressive AMD and, while sentiment surrounding Intel's shares appears negative, investors wait, as fundamentals for the company may get worse. As a result, investors who chose AMD back in 2002 had a return of 1,000%. In contrast, Intel's investors have been rewarded with a 50% return. |

|
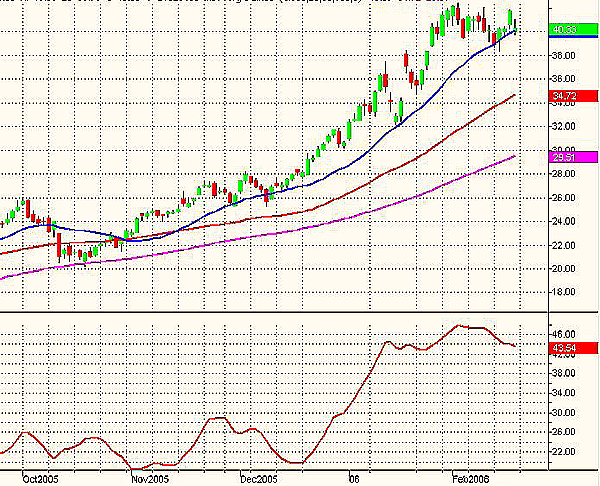
| FIGURE 1: ADVANCED MICRO DEVICES, DAILY. During the past four months, AMD has printed an impulse to the upside. |
| Graphic provided by: TradeStation. |
| |
| In Figure 1, the daily chart of AMD displays the uptrend of the stock. Since October 2005, it moved from the $21 level to the present $40. The average directional movement index (ADX) value is 43.5, confirming that a stable and strong trend is ongoing. The moving averages (20,50,100) are still opening and rising. Volatility is at the stock's highest levels since 2001. A parabolic rally is ongoing. Is it still possible for an investor to enter a long position? You never know how long these trends can last, but risk at these levels is getting increasingly higher. |

|
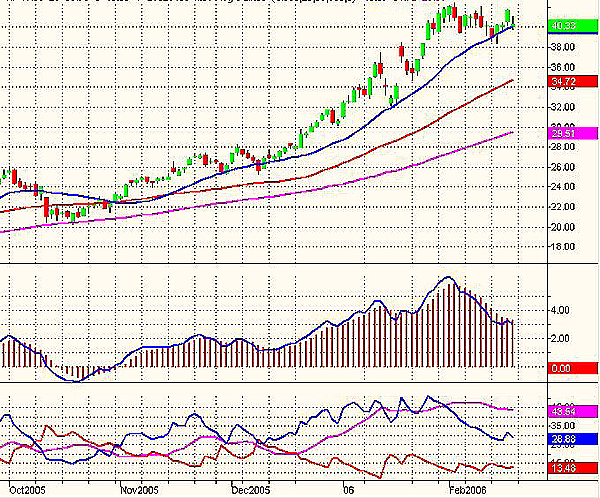
| FIGURE 2: ADVANCED MICRO DEVICES, DAILY. The MACD confirms the current consolidation phase in the daily time frame. The DMI provides positive indications. |
| Graphic provided by: TradeStation. |
| |
| In Figure 2, the moving average convergence/divergence (MACD) I used has a setting of 5,34,4. It provides good indications about momentum. As you can see, in the daily time frame, the MACD has been positive since November 2005. After the February 2nd high, however, prices started consolidating, confirmed by a decline of the indicator. At the same time, the directional movement index (DMI) continued to provide positive indications. |

|
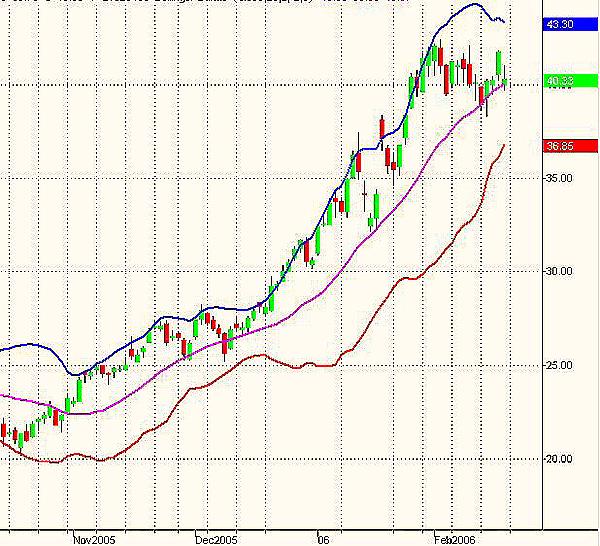
| FIGURE 3: ADVANCED MICRO DEVICES, DAILY. The Bollinger Bands indicate that a contraction in volatility is ongoing. |
| Graphic provided by: TradeStation. |
| |
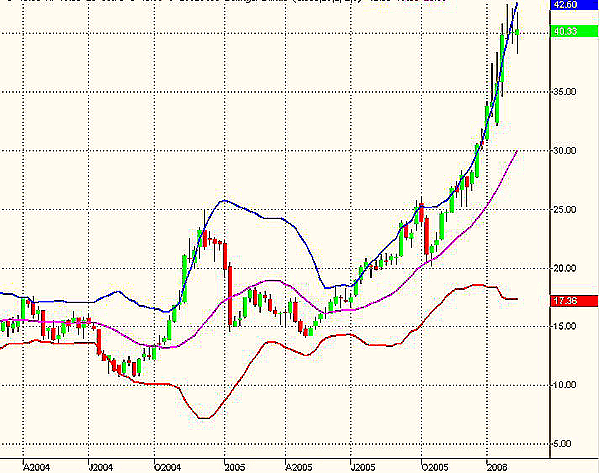
| The Bollinger Bands can help understand the evolution of volatility. In Figure 3, in the daily time frame the bands are converging. The idea is that volatility from these levels will contract in the short term. At the weekly level, an impulse is still ongoing. In these situations, it is difficult and dangerous to trade against the prevailing trend (Figure 4). The week of February 3 printed a shooting star candlestick pattern, which provides a warning of possible reversal moves. Prices opened near the low and, after a rally to the upside, closed near the low of the day. The pattern has a value in the short term, providing an indication of weakness. The following two weeks did not print significant corrections, but the high of this bar is now a resistance to the continuation of the move in the intermediate term. |

|
| FIGURE 4: ADVANCED MICRO DEVICES, WEEKLY. In this time frame, an impulse to the upside is still ongoing. The shooting star candlestick pattern provides indication of a resistance level. |
| Graphic provided by: TradeStation. |
| |
| Strict risk control is necessary to open new positions in this situation. Sharp selloffs can shake positions of weak hands at any moment. Normally, I do not tend to open trades in wild times; I'd rather wait for volatility to decrease, looking for support areas and indications that prices will try and test recent highs again. |
Author of the book "Trading the US Markets - A Comprehensive Guide to US Markets for International Traders and Investors" - Harriman House (July 2008)
| Address: | VIA ROBERTO AGO 26 POSTAL CODE 00166 |
| Rome, ITALY | |
| Phone # for sales: | +393357540708 |
| E-mail address: | pezzutti.paolo@tiscali.it |
Click here for more information about our publications!
Comments
Date: 02/21/06Rank: 5Comment:
Date: 02/22/06Rank: 4Comment:
Date: 02/28/06Rank: 4Comment:

Request Information From Our Sponsors
- StockCharts.com, Inc.
- Candle Patterns
- Candlestick Charting Explained
- Intermarket Technical Analysis
- John Murphy on Chart Analysis
- John Murphy's Chart Pattern Recognition
- John Murphy's Market Message
- MurphyExplainsMarketAnalysis-Intermarket Analysis
- MurphyExplainsMarketAnalysis-Visual Analysis
- StockCharts.com
- Technical Analysis of the Financial Markets
- The Visual Investor
- VectorVest, Inc.
- Executive Premier Workshop
- One-Day Options Course
- OptionsPro
- Retirement Income Workshop
- Sure-Fire Trading Systems (VectorVest, Inc.)
- Trading as a Business Workshop
- VectorVest 7 EOD
- VectorVest 7 RealTime/IntraDay
- VectorVest AutoTester
- VectorVest Educational Services
- VectorVest OnLine
- VectorVest Options Analyzer
- VectorVest ProGraphics v6.0
- VectorVest ProTrader 7
- VectorVest RealTime Derby Tool
- VectorVest Simulator
- VectorVest Variator
- VectorVest Watchdog
