HOT TOPICS LIST
- MACD
- Fibonacci
- RSI
- Gann
- ADXR
- Stochastics
- Volume
- Triangles
- Futures
- Cycles
- Volatility
- ZIGZAG
- MESA
- Retracement
- Aroon
INDICATORS LIST
LIST OF TOPICS
PRINT THIS ARTICLE
by David Penn
Breaking free from a symmetrical triangle in mid-February, the Dow industrials confirmed the earlier move higher in the transports -- and set up the markets for higher prices overall.
Position: N/A
David Penn
Technical Writer for Technical Analysis of STOCKS & COMMODITIES magazine, Working-Money.com, and Traders.com Advantage.
PRINT THIS ARTICLE
DOW THEORY
Confirming Industrials
02/17/06 02:13:32 PMby David Penn
Breaking free from a symmetrical triangle in mid-February, the Dow industrials confirmed the earlier move higher in the transports -- and set up the markets for higher prices overall.
Position: N/A
| A NASDAQ and a New York Stock Exchange (NYSE) Composite that fail to make new highs might be the stock market equivalent of the classic Carpenters single "Rainy Days and Mondays." Given that the NASDAQ is the measure of growth and the NYSE a measure of breadth, we could be forgiven for not seeing the upside to a stock universe that doesn't have these two in gear and leading the way. |

|
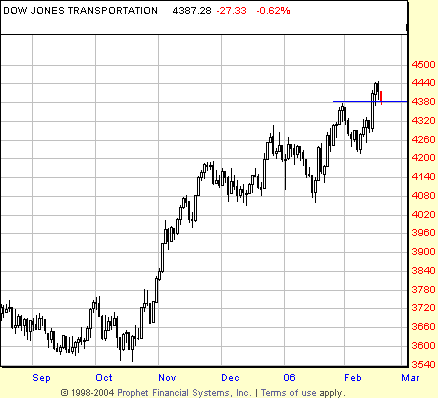
| FIGURE 1: DOW JONES TRANSPORTATION AVERAGE, DAILY. The Dow transports broke out in mid-February 2006, besting the highs of late January and creating a new, all-time high in the process. |
| Graphic provided by: Prophet Financial, Inc. |
| |
| But while I suspect that many market observers watched the Dow transports soar to still-higher all-time highs with barely suppressed yawns (after all, there ain't no semiconductors in the $TRAN, and it was Valentine's Day...), the breakout in the Dow industrials one day later certainly had to raise eyebrows (Figure 1). For while it was also on Valentine's Day that the industrials made their new-highs-teasing surge, it was the following day that saw a real, honest-to-goodness, new high in the Dow Jones Industrial Average (DJIA). This move on February 15 confirmed the move to new highs in the Dow transports and provided yet another warning to bears and short-sellers that continued to ply their trade at their own peril. |
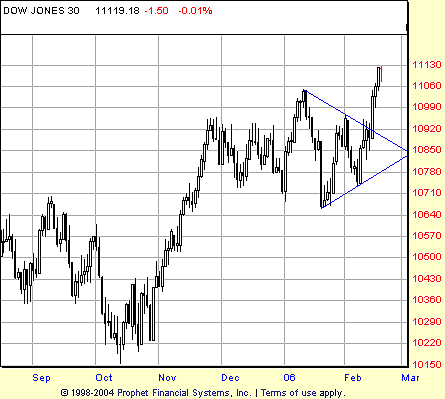
| I wrote about that symmetrical triangle in the Dow industrials in a recent article for Traders.com Advantage ("The Dow's Tempting Triangle," February 14). A successful breakout from this triangle, I suggested, "could see the industrials testing highs not seen since the late spring of 2001." The fact that this breakout coincides with a confirmation of the Dow transports move higher only underscores the possibility that significantly higher highs in the stock market could be in the making this spring (Figure 2). |

|
| FIGURE 2: DOW JONES INDUSTRIAL AVERAGE, DAILY. The breakout from this symmetrical triangle was also a break from a significant consolidation range that extended back to late November. |
| Graphic provided by: Prophet Financial, Inc. |
| |
| The Dow transports have already begun their pullback to the breakout level of 4380. A similar pullback level for the Dow industrials lies just south of 11060. Should these levels hold, creating a "DLB" (don't look back) breakout at this point, then the likelihood of seriously higher prices will be great. The price projection from the triangle in the Dow industrials, however, is worth repeating: given the size of the triangle and the breakout level between 10920-10940, the Dow industrials will come tantalizingly close to the highs made when the bear market in stocks from 2000 to 2002 was just a little correction. |
| In fact, considering what is measured right now to be the minimum upside price projection -- roughly 11327 -- the Dow industrials could be headed for a test of all-time highs. The highest monthly close in Dow history is 11497, merely 170 points away from the minimum upside projection, with the all-time print a little over 250 points away from that. There's no reason for traders to get ahead of themselves at this point, with both markets looking more than ready to pull back and consolidate recent gains. But if the prospect of all-time highs in the Dow industrials don't serve as a sort of magnet for anxious stock investors, it is hard to imagine what would. |
Technical Writer for Technical Analysis of STOCKS & COMMODITIES magazine, Working-Money.com, and Traders.com Advantage.
| Title: | Technical Writer |
| Company: | Technical Analysis, Inc. |
| Address: | 4757 California Avenue SW |
| Seattle, WA 98116 | |
| Phone # for sales: | 206 938 0570 |
| Fax: | 206 938 1307 |
| Website: | www.Traders.com |
| E-mail address: | DPenn@traders.com |
Traders' Resource Links | |
| Charting the Stock Market: The Wyckoff Method -- Books | |
| Working-Money.com -- Online Trading Services | |
| Traders.com Advantage -- Online Trading Services | |
| Technical Analysis of Stocks & Commodities -- Publications and Newsletters | |
| Working Money, at Working-Money.com -- Publications and Newsletters | |
| Traders.com Advantage -- Publications and Newsletters | |
| Professional Traders Starter Kit -- Software | |
Click here for more information about our publications!
Comments
Date: 02/17/06Rank: 3Comment:

Request Information From Our Sponsors
- StockCharts.com, Inc.
- Candle Patterns
- Candlestick Charting Explained
- Intermarket Technical Analysis
- John Murphy on Chart Analysis
- John Murphy's Chart Pattern Recognition
- John Murphy's Market Message
- MurphyExplainsMarketAnalysis-Intermarket Analysis
- MurphyExplainsMarketAnalysis-Visual Analysis
- StockCharts.com
- Technical Analysis of the Financial Markets
- The Visual Investor
- VectorVest, Inc.
- Executive Premier Workshop
- One-Day Options Course
- OptionsPro
- Retirement Income Workshop
- Sure-Fire Trading Systems (VectorVest, Inc.)
- Trading as a Business Workshop
- VectorVest 7 EOD
- VectorVest 7 RealTime/IntraDay
- VectorVest AutoTester
- VectorVest Educational Services
- VectorVest OnLine
- VectorVest Options Analyzer
- VectorVest ProGraphics v6.0
- VectorVest ProTrader 7
- VectorVest RealTime Derby Tool
- VectorVest Simulator
- VectorVest Variator
- VectorVest Watchdog
