HOT TOPICS LIST
- MACD
- Fibonacci
- RSI
- Gann
- ADXR
- Stochastics
- Volume
- Triangles
- Futures
- Cycles
- Volatility
- ZIGZAG
- MESA
- Retracement
- Aroon
INDICATORS LIST
LIST OF TOPICS
PRINT THIS ARTICLE
by Koos van der Merwe
Advanced Micro Devices, a semiconductor manufacturer with facilities in the US, Europe, and Asia, with sales offices throughout the world, has had its ups and downs.
Position: Hold
Koos van der Merwe
Has been a technical analyst since 1969, and has worked as a futures and options trader with First Financial Futures in Johannesburg, South Africa.
PRINT THIS ARTICLE
ELLIOTT WAVE
Advanced Micro Devices' Roller-Coaster Ride
02/17/06 01:54:02 PMby Koos van der Merwe
Advanced Micro Devices, a semiconductor manufacturer with facilities in the US, Europe, and Asia, with sales offices throughout the world, has had its ups and downs.
Position: Hold
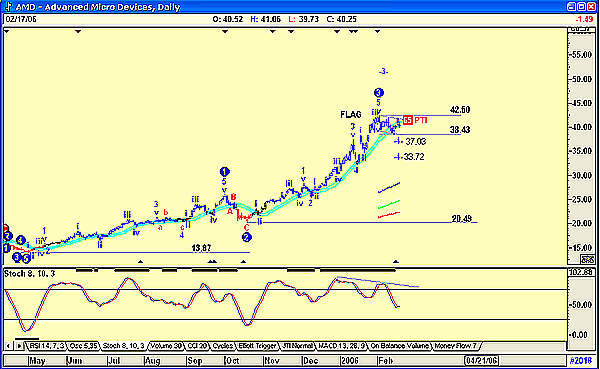
| Advanced Micro Devices (AMD) is not an unknown company, unless you have only recently begun to trade stocks. AMD was one of the high-flyers of the dotcom boom, reaching a high of $48.50 per share in June 2000 from a low of $6.38 in August 1998. After the bubble popped, the price dropped to a low of $3.10 by November 2002. In more recent days, the rise of the share to $42.42 by February 2006 can therefore be considered justification of investing in a solid company. Now, AMD has once again given a buy signal. Is it worth buying at this high price? Figure 1 is a daily chart of AMD and shows an acceptable Elliott wave count. |

|
| FIGURE 1: ADVANCED MICRO DEVICES, DAILY. This chart shows an acceptable Elliott wave count. |
| Graphic provided by: AdvancedGET. |
| |
| The chart shows the rise from the low of $13.87 in April 2005 and is suggesting that the price is in a wave 4 correction with a flag formation. Wave 4 is projected by the Advanced GET software as bottoming either at $37.03 or $33.72 with a 65 PTI (65% probability) that the wave 5 target will be $72.78 (not shown). Should the price break above the upper resistance line, the flag pattern suggests a target of $50.34 (42.40 - 20.49 = 11.91 + 38.43 = 50.34). Of course, the flag could fall further in line with the GET prediction of a wave 4 bottom. This will reduce the target for the flag, and could change the GET forecast for the wave 5 target. |
| My chosen indicator is a stochastic 8,10,3, and shows that the trend could still be down, so wait for a breakout of the price out of the flag pattern, which could be a good buy signal. |
| This is a share that should be on your watchlist. |
Has been a technical analyst since 1969, and has worked as a futures and options trader with First Financial Futures in Johannesburg, South Africa.
| Address: | 3256 West 24th Ave |
| Vancouver, BC | |
| Phone # for sales: | 6042634214 |
| E-mail address: | petroosp@gmail.com |
Click here for more information about our publications!
Comments
Date: 02/17/06Rank: 3Comment:
Date: 02/21/06Rank: 5Comment:

Request Information From Our Sponsors
- StockCharts.com, Inc.
- Candle Patterns
- Candlestick Charting Explained
- Intermarket Technical Analysis
- John Murphy on Chart Analysis
- John Murphy's Chart Pattern Recognition
- John Murphy's Market Message
- MurphyExplainsMarketAnalysis-Intermarket Analysis
- MurphyExplainsMarketAnalysis-Visual Analysis
- StockCharts.com
- Technical Analysis of the Financial Markets
- The Visual Investor
- VectorVest, Inc.
- Executive Premier Workshop
- One-Day Options Course
- OptionsPro
- Retirement Income Workshop
- Sure-Fire Trading Systems (VectorVest, Inc.)
- Trading as a Business Workshop
- VectorVest 7 EOD
- VectorVest 7 RealTime/IntraDay
- VectorVest AutoTester
- VectorVest Educational Services
- VectorVest OnLine
- VectorVest Options Analyzer
- VectorVest ProGraphics v6.0
- VectorVest ProTrader 7
- VectorVest RealTime Derby Tool
- VectorVest Simulator
- VectorVest Variator
- VectorVest Watchdog
