HOT TOPICS LIST
- MACD
- Fibonacci
- RSI
- Gann
- ADXR
- Stochastics
- Volume
- Triangles
- Futures
- Cycles
- Volatility
- ZIGZAG
- MESA
- Retracement
- Aroon
INDICATORS LIST
LIST OF TOPICS
PRINT THIS ARTICLE
by David Penn
After weeks of uncertainty, does a symmetrical triangle in the Dow Jones industrials signal a return to trending markets?
Position: N/A
David Penn
Technical Writer for Technical Analysis of STOCKS & COMMODITIES magazine, Working-Money.com, and Traders.com Advantage.
PRINT THIS ARTICLE
TRIANGLES
The Dow's Tempting Triangle
02/14/06 03:42:43 PMby David Penn
After weeks of uncertainty, does a symmetrical triangle in the Dow Jones industrials signal a return to trending markets?
Position: N/A
| A market making higher lows and lower highs ... after two months of largely trendless meandering, a maddening journey that has provided false hopes for bulls and bears alike, is it possible that the stodgiest of all markets, the Dow Jones Industrial Average (DJIA), could be the market ready to show investors, speculators, and traders alike the way? |

|
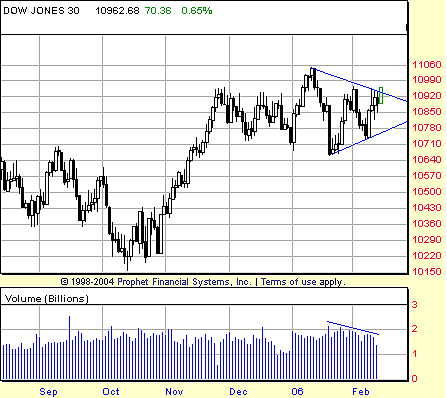
| FIGURE 1: DJIA, DAILY. The second half of the December-February consolidation appears to be taking the form of a symmetrical triangle. Note how volume contracts during the development of the triangle pattern. |
| Graphic provided by: Prophet Financial, Inc. |
| |
| A market making higher lows and lower highs ... if there is a shorthand definition of a symmetrical triangle, then that might be it. At a minimum, it's a good start. Symmetrical triangles are often key technical patterns insofar as the contraction in volatility that they represent tends to lead to a relatively dramatic expansion in volatility as soon as prices break free from the converging trendlines that form the boundaries of the formation (see Figure 1). |
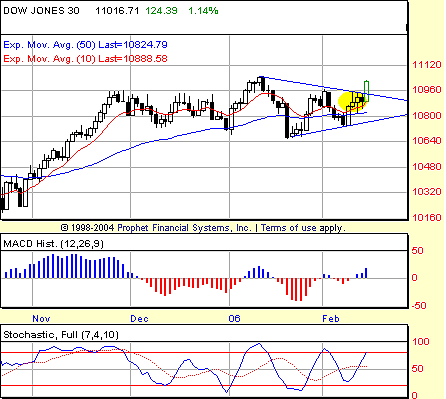
| Writing in his book Encyclopedia Of Chart Patterns, Thomas Bulkowski suggests that symmetrical triangles have at least two minor highs and two minor lows in order to be considered valid symmetrical triangles — "In other words," he writes, "at least four trend reversals." The symmetrical triangle in question is pretty close — particularly if you consider the advance into what by mid-session on Valentine's Day appeared to be the breakout the "fourth trend reversal" from the early February lows (see Figure 2). |

|
| FIGURE 2: DJIA, DAILY. Three closes above the 50-day exponential moving average helped reestablish the industrials' bias toward the upside. When the DJIA climbed above 11008 on Valentine's Day — besting a trigger price set by halving the range of the third day above the 50-day EMA and adding that value to the high of the day — bulls had their entry and the market looked to have its breakout. |
| Graphic provided by: Prophet Financial, Inc. |
| |
| Viewed from the perspective of the October bottom, a breakout in February would mean that the December–February consolidation was essentially a continuation pattern, an opportunity for accumulation by savvier market players and a chance for panic on the part of those less committed to the rally that began last autumn in 2005. There is even an argument that what I've called a symmetrical triangle is really just the late half of a diamond pattern. In either event, however, the trend and breakout price projections remain the same: a breakout will mean the resumption of the trend that began in October, and the market should be expected to climb at least as high as the formation is wide at its widest point. |

|
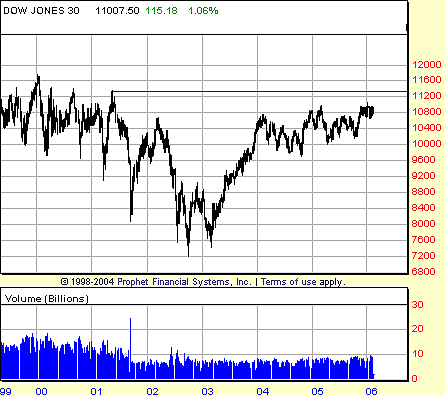
| FIGURE 3: DJIA, WEEKLY. A successful breakout from the symmetrical triangle in mid-February 2006 could see the industrials testing highs not seen since the late spring of 2001. |
| Graphic provided by: Prophet Financial, Inc. |
| |
| Given those measurement rules, an upside breakout from this symmetrical triangle could be expected to climb as high as 387 points beyond its breakout point (Figure 3). If we posit a breakout at 10940, then the minimum upside projection calls for the DJIA to reach 11327 before any significant correction occurs. Such a close would be the highest close in the industrials in many years — in fact, since May 2001, when there was a daily close on May 21 of 11337.90. |
Technical Writer for Technical Analysis of STOCKS & COMMODITIES magazine, Working-Money.com, and Traders.com Advantage.
| Title: | Technical Writer |
| Company: | Technical Analysis, Inc. |
| Address: | 4757 California Avenue SW |
| Seattle, WA 98116 | |
| Phone # for sales: | 206 938 0570 |
| Fax: | 206 938 1307 |
| Website: | www.Traders.com |
| E-mail address: | DPenn@traders.com |
Traders' Resource Links | |
| Charting the Stock Market: The Wyckoff Method -- Books | |
| Working-Money.com -- Online Trading Services | |
| Traders.com Advantage -- Online Trading Services | |
| Technical Analysis of Stocks & Commodities -- Publications and Newsletters | |
| Working Money, at Working-Money.com -- Publications and Newsletters | |
| Traders.com Advantage -- Publications and Newsletters | |
| Professional Traders Starter Kit -- Software | |
Click here for more information about our publications!
Comments
Date: 02/14/06Rank: 3Comment:
Date: 02/15/06Rank: 5Comment:

Request Information From Our Sponsors
- StockCharts.com, Inc.
- Candle Patterns
- Candlestick Charting Explained
- Intermarket Technical Analysis
- John Murphy on Chart Analysis
- John Murphy's Chart Pattern Recognition
- John Murphy's Market Message
- MurphyExplainsMarketAnalysis-Intermarket Analysis
- MurphyExplainsMarketAnalysis-Visual Analysis
- StockCharts.com
- Technical Analysis of the Financial Markets
- The Visual Investor
- VectorVest, Inc.
- Executive Premier Workshop
- One-Day Options Course
- OptionsPro
- Retirement Income Workshop
- Sure-Fire Trading Systems (VectorVest, Inc.)
- Trading as a Business Workshop
- VectorVest 7 EOD
- VectorVest 7 RealTime/IntraDay
- VectorVest AutoTester
- VectorVest Educational Services
- VectorVest OnLine
- VectorVest Options Analyzer
- VectorVest ProGraphics v6.0
- VectorVest ProTrader 7
- VectorVest RealTime Derby Tool
- VectorVest Simulator
- VectorVest Variator
- VectorVest Watchdog
