HOT TOPICS LIST
- MACD
- Fibonacci
- RSI
- Gann
- ADXR
- Stochastics
- Volume
- Triangles
- Futures
- Cycles
- Volatility
- ZIGZAG
- MESA
- Retracement
- Aroon
INDICATORS LIST
LIST OF TOPICS
PRINT THIS ARTICLE
by Arthur Hill
After a decline into mid-January, Wal-Mart firmed with a pair of inverted hammers, and improving OBV points to higher prices.
Position: Accumulate
Arthur Hill
Arthur Hill is currently editor of TDTrader.com, a website specializing in trading strategies, sector/industry specific breadth stats and overall technical analysis. He passed the Society of Technical Analysts (STA London) diploma exam with distinction is a Certified Financial Technician (CFTe). Prior to TD Trader, he was the Chief Technical Analyst for Stockcharts.com and the main contributor to the ChartSchool.
PRINT THIS ARTICLE
CANDLESTICK CHARTING
Inverted Hammers Find Support For Wal-Mart
02/14/06 01:28:49 PMby Arthur Hill
After a decline into mid-January, Wal-Mart firmed with a pair of inverted hammers, and improving OBV points to higher prices.
Position: Accumulate
| The inverted hammer is a single candlestick reversal pattern that requires confirmation. As the name suggests, these look like upside-down hammers. The body (white or black) is at the bottom of the range and there is a long upper shadow to mark the intraday high. The bulls were able to rally prices during the session, but not strong enough to hold these gains into the close. It is a failed rally attempt and therefore requires confirmation. See Figure 1. |

|
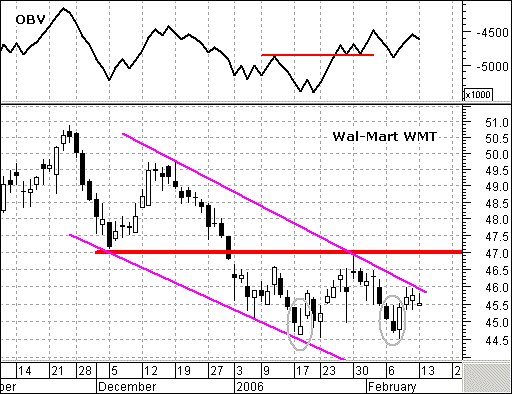
| FIGURE 1: WAL-MART. Wal-Mart formed inverted hammers on January 18 and February 7, signaling support around 44.5. |
| Graphic provided by: MetaStock. |
| Graphic provided by: Reuters Data. |
| |
| Wal-Mart (WMT) formed inverted hammers on January 18 and February 7. These signaled support around 44.5 and the stock bounced right after each inverted hammer. The first bounce to 47 failed and the stock returned to test the mid-January low. The second bounce is under way, and a break above the upper channel trendline would be most positive. The January 30th high at 47 marks key resistance and it would take a move above this level to fully reverse the downtrend. |
| On-balance volume (OBV) points to a breakout and further gains. OBV moved to a new low with the stock in mid-January. However, when the stock moved back to the January low in February, OBV held well above its corresponding low. In fact, OBV broke resistance in late January and is holding this breakout. Granville's indicator assumes that volume precedes price, and this points to a breakout at 47. |
Arthur Hill is currently editor of TDTrader.com, a website specializing in trading strategies, sector/industry specific breadth stats and overall technical analysis. He passed the Society of Technical Analysts (STA London) diploma exam with distinction is a Certified Financial Technician (CFTe). Prior to TD Trader, he was the Chief Technical Analyst for Stockcharts.com and the main contributor to the ChartSchool.
| Title: | Editor |
| Company: | TDTrader.com |
| Address: | Willem Geetsstraat 17 |
| Mechelen, B2800 | |
| Phone # for sales: | 3215345465 |
| Website: | www.tdtrader.com |
| E-mail address: | arthurh@tdtrader.com |
Traders' Resource Links | |
| TDTrader.com has not added any product or service information to TRADERS' RESOURCE. | |
Click here for more information about our publications!
Comments
Date: 02/14/06Rank: 4Comment:
Date: 02/15/06Rank: 4Comment:

Request Information From Our Sponsors
- StockCharts.com, Inc.
- Candle Patterns
- Candlestick Charting Explained
- Intermarket Technical Analysis
- John Murphy on Chart Analysis
- John Murphy's Chart Pattern Recognition
- John Murphy's Market Message
- MurphyExplainsMarketAnalysis-Intermarket Analysis
- MurphyExplainsMarketAnalysis-Visual Analysis
- StockCharts.com
- Technical Analysis of the Financial Markets
- The Visual Investor
- VectorVest, Inc.
- Executive Premier Workshop
- One-Day Options Course
- OptionsPro
- Retirement Income Workshop
- Sure-Fire Trading Systems (VectorVest, Inc.)
- Trading as a Business Workshop
- VectorVest 7 EOD
- VectorVest 7 RealTime/IntraDay
- VectorVest AutoTester
- VectorVest Educational Services
- VectorVest OnLine
- VectorVest Options Analyzer
- VectorVest ProGraphics v6.0
- VectorVest ProTrader 7
- VectorVest RealTime Derby Tool
- VectorVest Simulator
- VectorVest Variator
- VectorVest Watchdog
