HOT TOPICS LIST
- MACD
- Fibonacci
- RSI
- Gann
- ADXR
- Stochastics
- Volume
- Triangles
- Futures
- Cycles
- Volatility
- ZIGZAG
- MESA
- Retracement
- Aroon
INDICATORS LIST
LIST OF TOPICS
PRINT THIS ARTICLE
by David Penn
Negative stochastic divergences anticipate softness in prices for the yellow metal.
Position: N/A
David Penn
Technical Writer for Technical Analysis of STOCKS & COMMODITIES magazine, Working-Money.com, and Traders.com Advantage.
PRINT THIS ARTICLE
STOCHASTICS
Diverging The Gold
02/14/06 10:27:46 AMby David Penn
Negative stochastic divergences anticipate softness in prices for the yellow metal.
Position: N/A
| It's hard to imagine gold bugs being any happier than they've been over the past few months. Across the board, from gold exchange traded funds (ETFs) to gold mining stocks to gold futures, the yellow metal hasn't rewarded bulls with these kinds of gains in some time. |

|
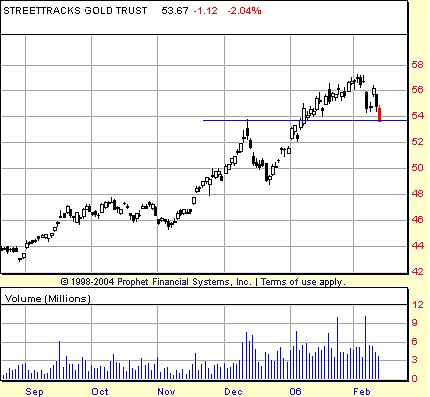
| FIGURE 1: STREETRACKS GOLD TRUST, DAILY. A "don't look back" breakout for GLD? The February correction takes the gold ETF back to the level of the December highs. |
| Graphic provided by: Prophet Financial, Inc. |
| |
| Given that gold recently experienced a fairly sharp correction back in December (Figure 1), it seems like the majority of gold bugs are taking the current softness in gold prices in stride. This may be the most reasonable approach for the time being insofar as gold — basis the gold shares ETF, GLD — is managing to find support at a level of old resistance: namely, those December highs. A similar "old resistance becomes new support" meme is working itself out in the chart of June gold shown in Figure 2. |
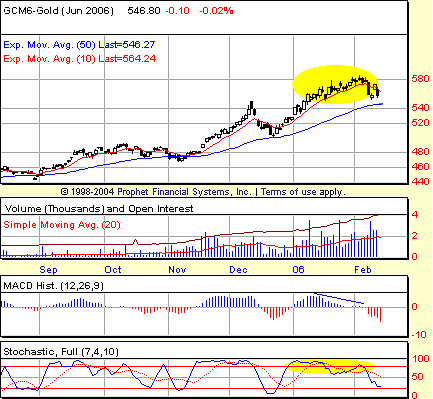
| Fortunately, the weakness in the price of gold (affectionately known as the "POG") was telegraphed by a pair of key technical indicators — namely, the stochastic and the moving average convergence/divergence (MACD) histogram. Both indicators showed that as gold, gold stocks, and the gold ETF were making their price highs in earliest February, they were doing so with less and less bullish momentum. The evidence for this lack of momentum came in the negative divergences that were traced out in both the stochastic and the MACD histogram immediately after the late January/early February price peaks were established. |

|
| FIGURE 2: JUNE GOLD FUTURES, DAILY. Negative divergences in both the MACD histogram and the stochastic anticipated an end, however temporary it may turn out to be, to gold's bull run. |
| Graphic provided by: Prophet Financial, Inc. |
| |
| What is interesting about the current correction is that a test of support has arrived so swiftly. No sooner did gold and gold stocks begin to break down in February before both the 50-day exponential moving average (EMA) and old resistance from the December highs (for the gold ETF and June gold futures) rose to meet them. The penetrability of these two potential sources of support remains to be seen: all three markets (GLD, GCM6, and $HUI) are currently at different levels of being oversold, and volume trends have been supportive of the rally in gold from its correction low near $500 in mid-December to its high near $580 first reached on the last day of January. |

|
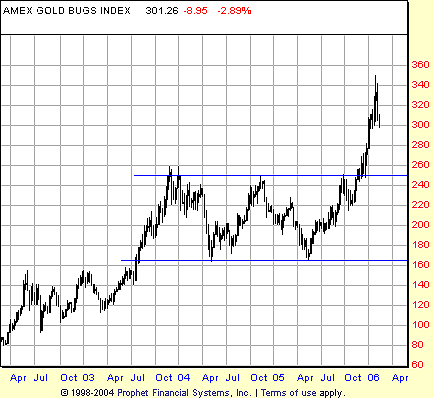
| FIGURE 3: AMEX GOLD BUGS INDEX, WEEKLY. A wide-ranging, two-year consolidation from the autumn of 2003 to the autumn of 2005 prepared the $HUI for its breakout late in 2005. |
| Graphic provided by: Prophet Financial, Inc. |
| |
| There are reasons why gold, which has been among the more reliable bull markets since the stock market topped in 2000, has run into some difficulty in recent days. As Figure 3 shows, gold stocks — which tend to lead the price of gold — were in a wide ranging, 90-point range for much of the two years between autumn 2003 and autumn 2005. The width of this range suggested that any break — to the upside or to the downside — would likely travel at least 90 points beyond the boundary of the range. To the downside, this meant a minimum potential to reach between 90 and 70 (!). To the upside, this meant a minimum potential to reach about 340. As the chart shows, it was the upside result that developed and shortly after an intraweek penetration of the 340 level — the $HUI first closed above 340 on a daily basis on January 31. Just what sort of pullback the $HUI will bring to gold traders, speculators, and investors is probably the key question going forward. |
Technical Writer for Technical Analysis of STOCKS & COMMODITIES magazine, Working-Money.com, and Traders.com Advantage.
| Title: | Technical Writer |
| Company: | Technical Analysis, Inc. |
| Address: | 4757 California Avenue SW |
| Seattle, WA 98116 | |
| Phone # for sales: | 206 938 0570 |
| Fax: | 206 938 1307 |
| Website: | www.Traders.com |
| E-mail address: | DPenn@traders.com |
Traders' Resource Links | |
| Charting the Stock Market: The Wyckoff Method -- Books | |
| Working-Money.com -- Online Trading Services | |
| Traders.com Advantage -- Online Trading Services | |
| Technical Analysis of Stocks & Commodities -- Publications and Newsletters | |
| Working Money, at Working-Money.com -- Publications and Newsletters | |
| Traders.com Advantage -- Publications and Newsletters | |
| Professional Traders Starter Kit -- Software | |
Click here for more information about our publications!
Comments
Date: 02/14/06Rank: 4Comment:
Date: 02/15/06Rank: 4Comment:

Request Information From Our Sponsors
- VectorVest, Inc.
- Executive Premier Workshop
- One-Day Options Course
- OptionsPro
- Retirement Income Workshop
- Sure-Fire Trading Systems (VectorVest, Inc.)
- Trading as a Business Workshop
- VectorVest 7 EOD
- VectorVest 7 RealTime/IntraDay
- VectorVest AutoTester
- VectorVest Educational Services
- VectorVest OnLine
- VectorVest Options Analyzer
- VectorVest ProGraphics v6.0
- VectorVest ProTrader 7
- VectorVest RealTime Derby Tool
- VectorVest Simulator
- VectorVest Variator
- VectorVest Watchdog
- StockCharts.com, Inc.
- Candle Patterns
- Candlestick Charting Explained
- Intermarket Technical Analysis
- John Murphy on Chart Analysis
- John Murphy's Chart Pattern Recognition
- John Murphy's Market Message
- MurphyExplainsMarketAnalysis-Intermarket Analysis
- MurphyExplainsMarketAnalysis-Visual Analysis
- StockCharts.com
- Technical Analysis of the Financial Markets
- The Visual Investor
