HOT TOPICS LIST
- MACD
- Fibonacci
- RSI
- Gann
- ADXR
- Stochastics
- Volume
- Triangles
- Futures
- Cycles
- Volatility
- ZIGZAG
- MESA
- Retracement
- Aroon
INDICATORS LIST
LIST OF TOPICS
PRINT THIS ARTICLE
by Paolo Pezzutti
A fast move to the downside brought prices to the first support level.
Position: N/A
Paolo Pezzutti
Author of the book "Trading the US Markets - A Comprehensive Guide to US Markets for International Traders and Investors" - Harriman House (July 2008)
PRINT THIS ARTICLE
TECHNICAL ANALYSIS
Amex Natural Gas Index: Testing Supports
02/13/06 04:26:41 PMby Paolo Pezzutti
A fast move to the downside brought prices to the first support level.
Position: N/A
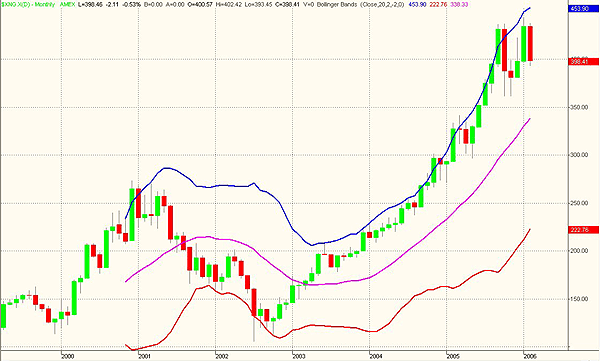
| Figure 1, the monthly chart of the Amex Natural Gas Index ($XNG), shows that since the 2002 low, prices have moved from the 105 level to about the present 400. The trend is impressive, with prices tagging the upper Bollinger Band throughout the period. Since September 2005, however, something has changed in the index's behavior. Volatility has increased. When reaching new highs, prices have developed fast corrections. In the market, risk at this price level is high and it overreacts to news. |

|
| FIGURE 1: AMEX NATURAL GAS, MONTHLY. During the last three years, $XNG has been in an uptrend. |
| Graphic provided by: TradeStation. |
| |
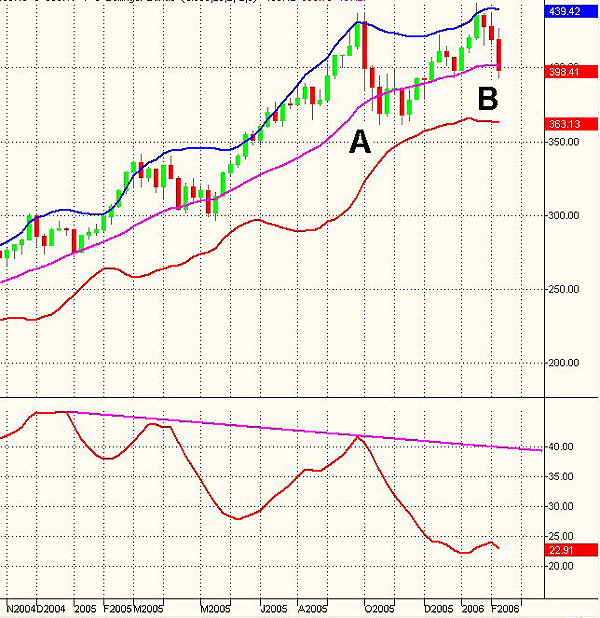
| At the weekly level (Figure 2), the high at point A at the beginning of October 2005 prints a negative divergence of the average directional movement index (ADX). The ADX measures the trend quality of a security, independent of direction; the greater the ADX value, the stronger a security is trending. Traditionally, values above 30 are assumed to indicate an ongoing trend. The test failure of the resistance level at 437, which is now an important resistance, at the end of January (point B) displays an even more significant divergence. The ADX value of 22.9 indicates that prices have entered a consolidation phase. This condition might develop in different ways. For the moment, we can only find confirmation using other indicators. The Bollinger Bands so far are parallel, indicating the absence of an impulse. A first target to the downside of this action could be the test of the previous lows in the 380-365 area. |

|
| FIGURE 2: AMEX NATURAL GAS, WEEKLY. Prices are now moving sideways. The resistance test in January failed |
| Graphic provided by: TradeStation. |
| |
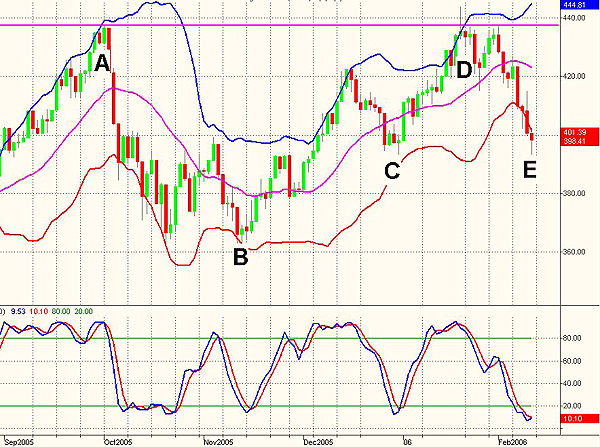
| The daily chart in Figure 3 displays the big swings that occurred during the past six months. At point A, the index printed a new high on October 3. A fast correction brought prices to a relative low on October 20. At point B, a double low formation provided an excellent entry point. The slow stochastic moved out of the oversold area, and after tagging the lower Bollinger Band, prices started a new leg of the uptrend. An a-b-c correction provided another entry opportunity at point C, with the oscillator once again oversold. Point D on January 20 shows the most interesting trading session in this time frame. Prices managed to test the previous relative high at point A during the trading session, then rallied to new highs only to close the day very close to the open level. This bar represents a shooting star candlestick pattern. It provides a warning of an impending reversal move. It has a small real body at the lower end of its range, with a long upper shadow. An ideal shooting star has a real body that gaps away from the prior real body, although this gap is not always necessary. The pattern has a value in the short term, providing indications of weakness. Coupled with indications that the oscillator is overbought, it can be used by traders as a long/short position trigger. In this case, it worked well. Since then, in fact, prices have moved fast to the downside. The Bollinger Bands are now opening, indicating that an impulse is being printed (point E). The stochastic is oversold. Prices are now testing the first support represented by the previous relative low at point C. |

|
| FIGURE 3: AMEX NATURAL GAS, DAILY. An important test of the first support is ongoing. |
| Graphic provided by: TradeStation. |
| |
| In the weekly time frame, the uptrend is over. Prices are moving to test their intermediate-term supports. This phase is important to understand if the index has the strength to test its highs again in the long term. In the short term it is likely to see lower prices in the daily time frame. |
Author of the book "Trading the US Markets - A Comprehensive Guide to US Markets for International Traders and Investors" - Harriman House (July 2008)
| Address: | VIA ROBERTO AGO 26 POSTAL CODE 00166 |
| Rome, ITALY | |
| Phone # for sales: | +393357540708 |
| E-mail address: | pezzutti.paolo@tiscali.it |
Click here for more information about our publications!
Comments
Date: 02/13/06Rank: 4Comment:
Date: 02/14/06Rank: 4Comment:
Date: 02/14/06Rank: 2Comment:

Request Information From Our Sponsors
- StockCharts.com, Inc.
- Candle Patterns
- Candlestick Charting Explained
- Intermarket Technical Analysis
- John Murphy on Chart Analysis
- John Murphy's Chart Pattern Recognition
- John Murphy's Market Message
- MurphyExplainsMarketAnalysis-Intermarket Analysis
- MurphyExplainsMarketAnalysis-Visual Analysis
- StockCharts.com
- Technical Analysis of the Financial Markets
- The Visual Investor
- VectorVest, Inc.
- Executive Premier Workshop
- One-Day Options Course
- OptionsPro
- Retirement Income Workshop
- Sure-Fire Trading Systems (VectorVest, Inc.)
- Trading as a Business Workshop
- VectorVest 7 EOD
- VectorVest 7 RealTime/IntraDay
- VectorVest AutoTester
- VectorVest Educational Services
- VectorVest OnLine
- VectorVest Options Analyzer
- VectorVest ProGraphics v6.0
- VectorVest ProTrader 7
- VectorVest RealTime Derby Tool
- VectorVest Simulator
- VectorVest Variator
- VectorVest Watchdog
