HOT TOPICS LIST
- MACD
- Fibonacci
- RSI
- Gann
- ADXR
- Stochastics
- Volume
- Triangles
- Futures
- Cycles
- Volatility
- ZIGZAG
- MESA
- Retracement
- Aroon
INDICATORS LIST
LIST OF TOPICS
PRINT THIS ARTICLE
by David Penn
Positive divergences in the MACD histogram and stochastic hint that an end to the first major correction of 2006 may be at hand.
Position: N/A
David Penn
Technical Writer for Technical Analysis of STOCKS & COMMODITIES magazine, Working-Money.com, and Traders.com Advantage.
PRINT THIS ARTICLE
REVERSAL
The S&P 500's Bernanke Bounce
02/09/06 11:15:25 AMby David Penn
Positive divergences in the MACD histogram and stochastic hint that an end to the first major correction of 2006 may be at hand.
Position: N/A
| Ben Bernanke, the new chairman of the Federal Reserve Board, isn't scheduled to testify before Congress until the middle of February. But given the way the markets responded to the announcement back in late October that "Helicopter Ben" would indeed take over from "Easy" Alan Greenspan (hint: the Dow Jones Industrial Average [DJIA] was up some 169 points that day), can you blame Wall Street for getting a little giddy in advance and staying that way? |

|
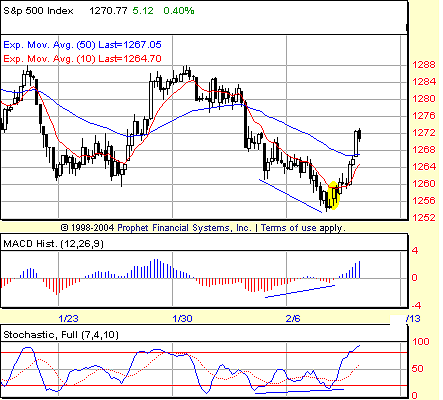
| FIGURE 1: S&P 500, HOURLY. Positive divergences in the MACD histogram and the stochastic anticipate the end of the downtrend that began in late January. |
| Graphic provided by: Prophet Financial, Inc. |
| |
| I have no idea whether the market surge in early February — a 120-plus point day in the DJIA on Wednesday the eighth, with follow-through into Thursday the ninth — is based on the anticipation of an end to earnings announcements and the official beginning of the Bernanke era. But given the way that financial news tends to be reported (that is, the insistence that there is some news item that is always specifically responsible for every move in the market), I figure this speculation is as good as any. |
| What can't be denied, however, is the fact that the market has been setting up for a bottom — or at least a bounce — for the past several days. We can tell this by the declining bearish momentum shown by the successively higher lows in the stochastic — a running positive divergence that was adopted by the moving average convergence/divergence (MACD) histogram after the first positive stochastic divergence was created (Figure 1). |

|
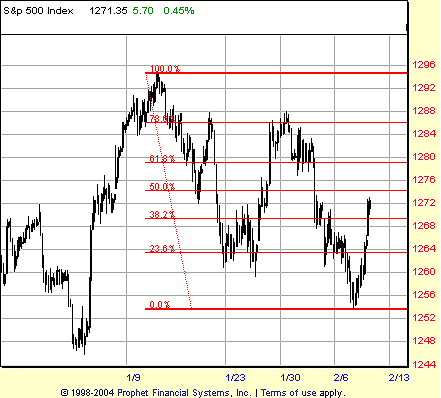
| FIGURE 2: S&P 500, DAILY. The current bounce in the S&P 500 has retraced nearly 50% of the year-to-date decline. |
| Graphic provided by: Prophet Financial, Inc. |
| |
| The lows in early February are interesting, especially because they help resolve a few outstanding technical issues. For example, since the market top about one month ago on January 11, the Standard & Poor's 500 has made hourly MACD histogram extremes late on the 20th and around midday on February 2. In order to form a bottom, the price lows that accompanied these extremes had to be exceeded by lower price lows. Moreover, those lower price lows preferably would be accompanied by higher lows in the MACD histogram. The price lows on January 25 did this for the January 20th lows, and the most recent lows in early February appear to be doing this for the February 2nd lows. |
| The bounce has retraced just over 50% of the decline since the late January top and just shy of 50% of the decline since the year-to-date top on January 11 (Figure 2). This puts the move squarely in the "normal bounce" category (between the Fibonacci retracement levels of 38.2% and 61.8%). An end to the upside here or, conversely, continued progress higher should tell traders and speculators a great deal about the readiness of the market to move higher — perhaps testing the year-to-date highs — in the early spring. |
Technical Writer for Technical Analysis of STOCKS & COMMODITIES magazine, Working-Money.com, and Traders.com Advantage.
| Title: | Technical Writer |
| Company: | Technical Analysis, Inc. |
| Address: | 4757 California Avenue SW |
| Seattle, WA 98116 | |
| Phone # for sales: | 206 938 0570 |
| Fax: | 206 938 1307 |
| Website: | www.Traders.com |
| E-mail address: | DPenn@traders.com |
Traders' Resource Links | |
| Charting the Stock Market: The Wyckoff Method -- Books | |
| Working-Money.com -- Online Trading Services | |
| Traders.com Advantage -- Online Trading Services | |
| Technical Analysis of Stocks & Commodities -- Publications and Newsletters | |
| Working Money, at Working-Money.com -- Publications and Newsletters | |
| Traders.com Advantage -- Publications and Newsletters | |
| Professional Traders Starter Kit -- Software | |
Click here for more information about our publications!
Comments
Date: 02/09/06Rank: 3Comment:
Date: 02/10/06Rank: 3Comment: I m looking at the weekly charts and I see weakness. My Point and Figure charts tell me a very different story than what you see. I see a 400 point correction on the horizon.
Dom Ciuffetelli
dciuffetelli@verizon.net
Date: 02/14/06Rank: 3Comment:
Date: 02/14/06Rank: 2Comment:

|

Request Information From Our Sponsors
- StockCharts.com, Inc.
- Candle Patterns
- Candlestick Charting Explained
- Intermarket Technical Analysis
- John Murphy on Chart Analysis
- John Murphy's Chart Pattern Recognition
- John Murphy's Market Message
- MurphyExplainsMarketAnalysis-Intermarket Analysis
- MurphyExplainsMarketAnalysis-Visual Analysis
- StockCharts.com
- Technical Analysis of the Financial Markets
- The Visual Investor
- VectorVest, Inc.
- Executive Premier Workshop
- One-Day Options Course
- OptionsPro
- Retirement Income Workshop
- Sure-Fire Trading Systems (VectorVest, Inc.)
- Trading as a Business Workshop
- VectorVest 7 EOD
- VectorVest 7 RealTime/IntraDay
- VectorVest AutoTester
- VectorVest Educational Services
- VectorVest OnLine
- VectorVest Options Analyzer
- VectorVest ProGraphics v6.0
- VectorVest ProTrader 7
- VectorVest RealTime Derby Tool
- VectorVest Simulator
- VectorVest Variator
- VectorVest Watchdog
