HOT TOPICS LIST
- MACD
- Fibonacci
- RSI
- Gann
- ADXR
- Stochastics
- Volume
- Triangles
- Futures
- Cycles
- Volatility
- ZIGZAG
- MESA
- Retracement
- Aroon
INDICATORS LIST
LIST OF TOPICS
PRINT THIS ARTICLE
by Koos van der Merwe
On Tuesday, February 7, the morning fix of the London gold price dropped suddenly from $568.25 to $548.65, a drop of 3.45%. What happened?
Position: Accumulate
Koos van der Merwe
Has been a technical analyst since 1969, and has worked as a futures and options trader with First Financial Futures in Johannesburg, South Africa.
PRINT THIS ARTICLE
ELLIOTT WAVE
The i-Unit That Is Gold
02/08/06 11:45:20 AMby Koos van der Merwe
On Tuesday, February 7, the morning fix of the London gold price dropped suddenly from $568.25 to $548.65, a drop of 3.45%. What happened?
Position: Accumulate
| The price of gold has been strengthening because of world tensions. The threat of a nuclear bomb in Iran and the win by Hamas in Palestine, plus the increase in suicide bombings in Iraq and Afghanistan, all lead to world tension. The threat of Hamas could result in a preemptive strike by Israel, escalating the unrest being fueled by Muslim extremists against the Jewish state, and recently with the Danish editorial cartoon fiasco, against the Western world in general. What led to the drop? The news that Russia and Iran are talking in an attempt to defuse the heightening political tension. As we know, gold is effectively demonetized and its use is purely for jewelry, and yet certain reserve banks throughout the world are accumulating gold as a hedge against the possible depreciation of the currencies as the US dollar strengthens. Do I believe that the US dollar will strengthen? Isn't that contrary to the accepted belief that a weaker dollar will assist the US in paying off its humongous balance of payment debt? My article of January 25, 2006, "Gold To Currencies," does show that gold and the US dollar appear to be moving in tandem, both regarded as a safe haven as world tension vacillates. |
| With gold's recent dramatic rise and fall, the main victims were mining houses, which were overbought as gold rose and probably oversold with the recent drop. This volatility could scare many who would like to have a portion of their portfolios in gold shares rather than gold mutual funds, which are a great deal less volatile. And because of this, we must look to exchange traded funds (ETFs). In Canada, the most favored ETF that tracks the gold price is the i-Unit S&P/TSX Capped Gold Index Fund (XGD-T). |
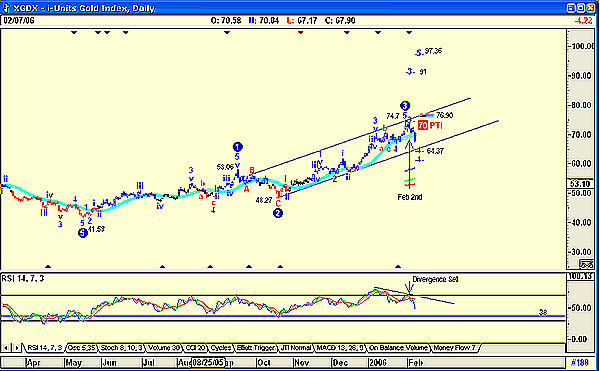
| Figure 1 is of the XGD-T and shows how on February 2, a divergence sell was given by the indicator. A divergence sell is where the XGD made higher highs not confirmed by the relative strength index (RSI). |

|
| FIGURE 1: I-UNIT S&P/TSX CAPPED GOLD INDEX FUND. The wave count on the chart is suggesting that the XGD is traving a fourth wave, which could see it testing the 64.37 level, a further fall of 5.2%. |
| Graphic provided by: AdvancedGET. |
| |
| How low can the XGD go? The wave count is suggesting that the XGD is tracing an Elliott fourth wave, which could see it testing the 64.37 level, a further fall of 5.2%. This would take it to the support trendline and would allow the RSI to fall to the 38% level, the most common level on the chart, and confirm a buy signal. The chart is also suggesting that wave 3 is not necessarily complete and suggests a rise to $91 as a wave 3 top is possible. However, wave 3 appears complete, because the rise of wave I was from 41.58 to 58.06, a rise of 16.48. The rise of wave III was from 48.27 to 74.7, a rise of 26.43, which is a ratio of 1.604% ((26.43/16.48)*100), close enough to the Fibonacci ratio of 1.618% to be acceptable. Figure 1 also suggests that there is a 70% probability (70 PTI) that the price will rise to complete wave V at 97.36, a 51% increase from the low of 64.37. Whether these projections will actually play out is speculation, but the chart does provide direction and suggests that a buy of XGD at and around 64.37 could be a very profitable play. |
| Of course, for the XGD to rise to these levels, gold will have to move close to if not above the $600 mark, and this suggests escalating world tension. |
Has been a technical analyst since 1969, and has worked as a futures and options trader with First Financial Futures in Johannesburg, South Africa.
| Address: | 3256 West 24th Ave |
| Vancouver, BC | |
| Phone # for sales: | 6042634214 |
| E-mail address: | petroosp@gmail.com |
Click here for more information about our publications!
Comments
Date: 02/08/06Rank: 3Comment:
Date: 02/09/06Rank: 3Comment:
Date: 02/10/06Rank: 5Comment:

Request Information From Our Sponsors
- StockCharts.com, Inc.
- Candle Patterns
- Candlestick Charting Explained
- Intermarket Technical Analysis
- John Murphy on Chart Analysis
- John Murphy's Chart Pattern Recognition
- John Murphy's Market Message
- MurphyExplainsMarketAnalysis-Intermarket Analysis
- MurphyExplainsMarketAnalysis-Visual Analysis
- StockCharts.com
- Technical Analysis of the Financial Markets
- The Visual Investor
- VectorVest, Inc.
- Executive Premier Workshop
- One-Day Options Course
- OptionsPro
- Retirement Income Workshop
- Sure-Fire Trading Systems (VectorVest, Inc.)
- Trading as a Business Workshop
- VectorVest 7 EOD
- VectorVest 7 RealTime/IntraDay
- VectorVest AutoTester
- VectorVest Educational Services
- VectorVest OnLine
- VectorVest Options Analyzer
- VectorVest ProGraphics v6.0
- VectorVest ProTrader 7
- VectorVest RealTime Derby Tool
- VectorVest Simulator
- VectorVest Variator
- VectorVest Watchdog
