HOT TOPICS LIST
- MACD
- Fibonacci
- RSI
- Gann
- ADXR
- Stochastics
- Volume
- Triangles
- Futures
- Cycles
- Volatility
- ZIGZAG
- MESA
- Retracement
- Aroon
INDICATORS LIST
LIST OF TOPICS
PRINT THIS ARTICLE
by David Penn
Was the late January rally a "don't look back" breakout?
Position: N/A
David Penn
Technical Writer for Technical Analysis of STOCKS & COMMODITIES magazine, Working-Money.com, and Traders.com Advantage.
PRINT THIS ARTICLE
BREAKOUTS
Halliburton Returns To Its Breakout
02/08/06 11:26:30 AMby David Penn
Was the late January rally a "don't look back" breakout?
Position: N/A
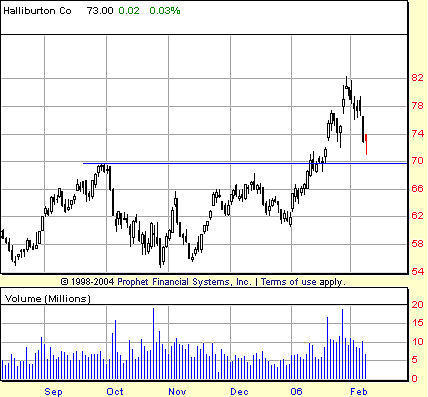
| A little over two years ago, I wrote an article for Working Money.com called "Building A Better Breakout" (July 1, 2003). The article discussed Donchian channels, but the true gem was the emphasis on the way that resistance once broken often becomes a source of support (Figure 1). When markets break out, pull back, and find support at a previous resistance level, I have referred to them as "don't look back" (DLB) breakouts that often signal a powerful trend that is likely to take the market higher (or lower, in the case of DLB breakdowns). |

|
| FIGURE 1: HALLIBURTON, DAILY. Breaking out above resistance in the form of the late September highs, HAL rallies three-quarters of the way to its minimum price objective of 86 before pulling back sharply. That pullback is currently testing the old breakout level for support. |
| Graphic provided by: Prophet Financial, Inc. |
| |
| Because buying breakouts is such a popular strategy for even modestly technical traders, the DLB concept can be particularly helpful. Often, by the time a trader or speculator notices that a given market has broken free from a consolidation or chart pattern, the market has moved several points beyond the breakout level. Buying the market at this point exposes the trader or speculator to the very real possibility of a pullback that will result in often-instantaneous losses for the position. The DLB concept, among other things, allows traders to put markets that are breaking out in a watchlist, so that their almost inevitable pullbacks can be monitored and gauged. Those markets that pull back without slipping back below the previous resistance level are likely to be those markets that will resume their bullish ways once the correction has run its course. |
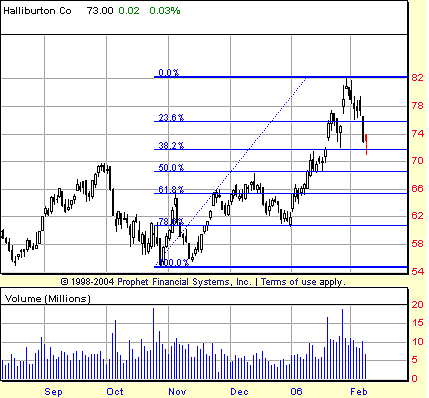
| This appears to be happening in Halliburton, which broke free from a cup with handle type of consolidation in mid-January 2006 and has spent the last few days of January and the first few of February pulling back from the highs reached in that breakout. The cup with handle formation itself suggested a minimum upside move to 86, a few points higher than the current high in HAL's breakout. And if this breakout turns out to be a DLB situation, then that 86 level will remain the initial target for any advance. See Figure 2. |

|
| FIGURE 2: HALLIBURTON, DAILY. The correction in HAL finds the market retreating to the 38.2% retracement level. There is also potential support at the 50% retracement level, which coincides with the December highs. The gap up in mid-January might also provide a measure of support, limiting the ability of the correction to retrace the November 2005–January 2006 advance further. |
| Graphic provided by: Prophet Financial, Inc. |
| |
| As I wrote recently for Traders.com Advantage, the current correction in crude oil could quite likely be merely another temporary downturn in the secular bull market in black gold (most recently in my "Crude Comes In [Again]," February 7, 2006). As such, any firming in crude oil prices is likely to have a positive impact on oil shares and vice versa, insofar as intermarket technical analysis suggests that it will be oil stocks that lead crude oil, rather than the other way around. A DLB breakout in Halliburton, a breakout with a pullback that finds support at the level of the previous breakout/resistance level, would be consistent with this, as well as providing encouragement for other oil stocks. |

|
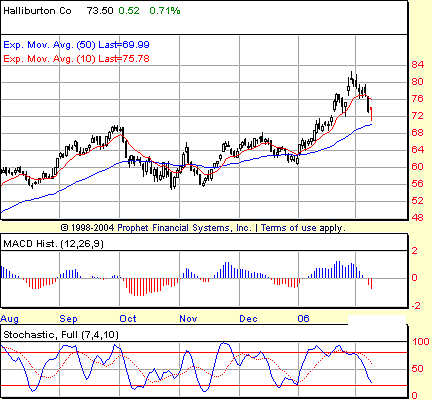
| FIGURE 3: HALLIBURTON, DAILY. A running negative divergence in the stochastic over January anticipated the correction in February. As long as the stock remains above its 50-day EMA, watch for a positive reversal in the MACD histogram as one of the first signs that HAL may be ready to resume its ascent. |
| Graphic provided by: Prophet Financial, Inc. |
| |
| Because Halliburton is still trading above its 50-day exponential moving average (EMA), there is no reason to worry about needing a positive divergence in the stochastic (or the moving average convergence/divergence [MACD] histogram, for that matter) to signal a bottom. However sharp the correction, as long as the market in question is above the 50-day EMA, I tend to consider the market still more susceptible to higher prices than lower and "dips" that hold above the 50-day EMA (as Charles B. Schaap pointed out in the very helpful Working Money article, "The 50-50 Strategy," December 10, 2003) are often excellent buying opportunities (Figure 3). The fact that the 50-day EMA is at approximately the same level as the breakout level is another feature of what still looks like a buyable correction in shares of Halliburton. |
Technical Writer for Technical Analysis of STOCKS & COMMODITIES magazine, Working-Money.com, and Traders.com Advantage.
| Title: | Technical Writer |
| Company: | Technical Analysis, Inc. |
| Address: | 4757 California Avenue SW |
| Seattle, WA 98116 | |
| Phone # for sales: | 206 938 0570 |
| Fax: | 206 938 1307 |
| Website: | www.Traders.com |
| E-mail address: | DPenn@traders.com |
Traders' Resource Links | |
| Charting the Stock Market: The Wyckoff Method -- Books | |
| Working-Money.com -- Online Trading Services | |
| Traders.com Advantage -- Online Trading Services | |
| Technical Analysis of Stocks & Commodities -- Publications and Newsletters | |
| Working Money, at Working-Money.com -- Publications and Newsletters | |
| Traders.com Advantage -- Publications and Newsletters | |
| Professional Traders Starter Kit -- Software | |
Click here for more information about our publications!
Comments
Date: 02/08/06Rank: 3Comment:

Request Information From Our Sponsors
- StockCharts.com, Inc.
- Candle Patterns
- Candlestick Charting Explained
- Intermarket Technical Analysis
- John Murphy on Chart Analysis
- John Murphy's Chart Pattern Recognition
- John Murphy's Market Message
- MurphyExplainsMarketAnalysis-Intermarket Analysis
- MurphyExplainsMarketAnalysis-Visual Analysis
- StockCharts.com
- Technical Analysis of the Financial Markets
- The Visual Investor
- VectorVest, Inc.
- Executive Premier Workshop
- One-Day Options Course
- OptionsPro
- Retirement Income Workshop
- Sure-Fire Trading Systems (VectorVest, Inc.)
- Trading as a Business Workshop
- VectorVest 7 EOD
- VectorVest 7 RealTime/IntraDay
- VectorVest AutoTester
- VectorVest Educational Services
- VectorVest OnLine
- VectorVest Options Analyzer
- VectorVest ProGraphics v6.0
- VectorVest ProTrader 7
- VectorVest RealTime Derby Tool
- VectorVest Simulator
- VectorVest Variator
- VectorVest Watchdog
